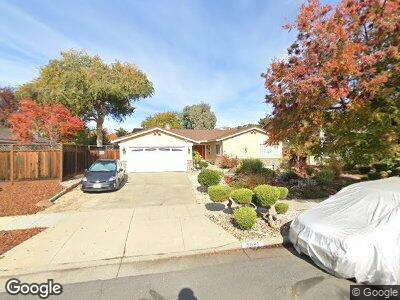
6691 Bret Harte Dr San Jose, CA 95120
Shadow Brook II NeighborhoodEstimated Value: $2,276,000 - $2,356,000
4
Beds
2
Baths
2,029
Sq Ft
$1,134/Sq Ft
Est. Value
About This Home
This home is located at 6691 Bret Harte Dr, San Jose, CA 95120 and is currently estimated at $2,300,820, approximately $1,133 per square foot. 6691 Bret Harte Dr is a home located in Santa Clara County with nearby schools including Graystone Elementary School, Bret Harte Middle School, and Leland High School.
Ownership History
Date
Name
Owned For
Owner Type
Purchase Details
Closed on
Feb 20, 2015
Sold by
Congirlu Mahyar
Bought by
Congirlu Mahyar
Current Estimated Value
Purchase Details
Closed on
Apr 24, 2006
Sold by
Congirlu Brigette
Bought by
Congirlu Mahyar
Home Financials for this Owner
Home Financials are based on the most recent Mortgage that was taken out on this home.
Original Mortgage
$40,000
Interest Rate
6.29%
Mortgage Type
Credit Line Revolving
Purchase Details
Closed on
Jun 3, 2002
Sold by
Lutz Howard and Lutz Joan
Bought by
Congirlu Mahyar and Congirlu Brigette
Home Financials for this Owner
Home Financials are based on the most recent Mortgage that was taken out on this home.
Original Mortgage
$481,000
Interest Rate
6.83%
Purchase Details
Closed on
Jul 25, 1996
Sold by
Lutz Howard and Lutz Joan
Bought by
Lutz Howard and Lutz Joan A
Create a Home Valuation Report for This Property
The Home Valuation Report is an in-depth analysis detailing your home's value as well as a comparison with similar homes in the area
Home Values in the Area
Average Home Value in this Area
Purchase History
| Date | Buyer | Sale Price | Title Company |
|---|---|---|---|
| Congirlu Mahyar | -- | None Available | |
| Congirlu Mahyar | -- | Placer Title Company | |
| Congirlu Mahyar | $781,000 | Alliance Title Company | |
| Lutz Howard | -- | -- |
Source: Public Records
Mortgage History
| Date | Status | Borrower | Loan Amount |
|---|---|---|---|
| Open | Congirlu Mahyar | $45,000 | |
| Closed | Congirlu Mahyar | $40,000 | |
| Open | Congirlu Mahyar | $760,000 | |
| Closed | Congirlu Mahyar | $480,000 | |
| Closed | Congirlu Mahyar | $480,000 | |
| Closed | Congirlu Mahyar | $481,000 | |
| Previous Owner | Lutz Howard | $45,000 |
Source: Public Records
Tax History Compared to Growth
Tax History
| Year | Tax Paid | Tax Assessment Tax Assessment Total Assessment is a certain percentage of the fair market value that is determined by local assessors to be the total taxable value of land and additions on the property. | Land | Improvement |
|---|---|---|---|---|
| 2023 | $14,381 | $1,108,953 | $609,854 | $499,099 |
| 2022 | $14,246 | $1,087,210 | $597,897 | $489,313 |
| 2021 | $13,964 | $1,065,893 | $586,174 | $479,719 |
| 2020 | $13,660 | $1,054,965 | $580,164 | $474,801 |
| 2019 | $13,373 | $1,034,281 | $568,789 | $465,492 |
| 2018 | $13,244 | $1,014,002 | $557,637 | $456,365 |
| 2017 | $13,142 | $994,120 | $546,703 | $447,417 |
| 2016 | $12,941 | $974,629 | $535,984 | $438,645 |
| 2015 | $12,861 | $959,991 | $527,934 | $432,057 |
| 2014 | $12,333 | $941,187 | $517,593 | $423,594 |
Source: Public Records
Map
Nearby Homes
- 6828 Trinidad Dr
- 6630 Mount Holly Dr
- 6808 Almaden Rd
- 6769 Mount Leneve Dr
- 6805 Almaden Rd
- 950 Marlinton Ct
- 6592 Copperwood Cir
- 1169 Silver Shadow Dr
- 6567 Camden Ave
- 1215 Weeping Oaks Ct
- 1145 Coach Ct
- 6529 Camden Ave
- 967 Woodthrush Ct
- 6843 Dalmeny Ct
- 00 Elmsdale Dr
- 7058 Pelican Ridge Dr
- 6524 Bose Ln
- 7156 Brooktree Way
- 6233 Hancock Ave
- 1101 Culligan Blvd