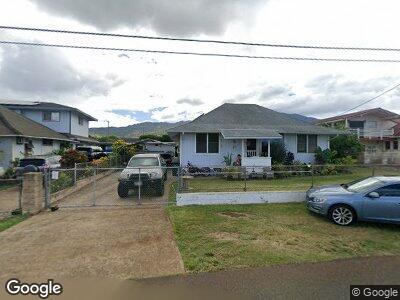
67-180 Kanoena St Waialua, HI 96791
North Shore NeighborhoodEstimated Value: $769,000 - $1,581,000
5
Beds
2
Baths
1,834
Sq Ft
$643/Sq Ft
Est. Value
About This Home
This home is located at 67-180 Kanoena St, Waialua, HI 96791 and is currently estimated at $1,179,547, approximately $643 per square foot. 67-180 Kanoena St is a home located in Honolulu County with nearby schools including Waialua Elementary School, Waialua High & Intermediate School, and St Michael School.
Ownership History
Date
Name
Owned For
Owner Type
Purchase Details
Closed on
Nov 27, 2007
Sold by
Fallas Anthony E
Bought by
Fallas Anthony E and Fallas Kim Phoung Thi
Current Estimated Value
Purchase Details
Closed on
Jun 2, 2003
Sold by
Dixon Marc Jerome and Elbern Jessica Gerda
Bought by
Fallas Anthony E
Home Financials for this Owner
Home Financials are based on the most recent Mortgage that was taken out on this home.
Original Mortgage
$319,500
Interest Rate
5.37%
Mortgage Type
Unknown
Purchase Details
Closed on
Aug 6, 1998
Sold by
Gay Timon E and Ocampo Paul A
Bought by
Dixon Marc Jerome and Elbern Jessica Gerda
Home Financials for this Owner
Home Financials are based on the most recent Mortgage that was taken out on this home.
Original Mortgage
$120,000
Interest Rate
6.91%
Mortgage Type
Seller Take Back
Purchase Details
Closed on
Feb 5, 1997
Sold by
Misajon Ocampo Josephine
Bought by
Gay Timon E and Ocampo Paul A
Create a Home Valuation Report for This Property
The Home Valuation Report is an in-depth analysis detailing your home's value as well as a comparison with similar homes in the area
Home Values in the Area
Average Home Value in this Area
Purchase History
| Date | Buyer | Sale Price | Title Company |
|---|---|---|---|
| Fallas Anthony E | -- | None Available | |
| Fallas Anthony E | $355,000 | -- | |
| Dixon Marc Jerome | $140,000 | -- | |
| Gay Timon E | -- | -- |
Source: Public Records
Mortgage History
| Date | Status | Borrower | Loan Amount |
|---|---|---|---|
| Open | Fallas Anthony E | $554,746 | |
| Closed | Fallas Anthony E | $547,000 | |
| Closed | Fallas Anthony E | $525,000 | |
| Closed | Fallas Anthony E | $547,500 | |
| Closed | Fallas Anthony E | $405,000 | |
| Closed | Fallas Anthony E | $319,500 | |
| Previous Owner | Dixon Marc Jerome | $120,000 |
Source: Public Records
Tax History Compared to Growth
Tax History
| Year | Tax Paid | Tax Assessment Tax Assessment Total Assessment is a certain percentage of the fair market value that is determined by local assessors to be the total taxable value of land and additions on the property. | Land | Improvement |
|---|---|---|---|---|
| 2024 | $2,836 | $970,400 | $881,000 | $89,400 |
| 2023 | $2,509 | $956,800 | $802,400 | $154,400 |
| 2022 | $2,497 | $853,400 | $567,000 | $286,400 |
| 2021 | $2,510 | $857,000 | $567,000 | $290,000 |
| 2020 | $2,832 | $949,200 | $524,200 | $425,000 |
| 2019 | $2,684 | $886,800 | $577,700 | $309,100 |
| 2018 | $2,275 | $770,100 | $502,800 | $267,300 |
| 2017 | $2,119 | $725,400 | $460,000 | $265,400 |
| 2016 | $1,968 | $682,400 | $449,300 | $233,100 |
| 2015 | $1,689 | $602,600 | $363,800 | $238,800 |
| 2014 | -- | $516,100 | $353,100 | $163,000 |
Source: Public Records
Map
Nearby Homes
- 67-636 Kane Place
- 67-540 Kahui St
- 67-174 B #1 Farrington Hwy
- 67-33 Naluahi St
- 66-397 Waialua Beach Rd
- 67-458 Kukea Cir
- 66-465 Kaamooloa Rd
- 66-284 Waialua Beach Rd Unit D
- 67-243 Kaui St
- 66-826 Haleiwa Rd
- 65-0500 Kaukonahua Rd
- 67-278 Kukea Cir Unit A
- 67-221 Kiapoko St
- 66166 Waialua Beach Rd Unit A
- 66-839 Kamakahala St
- 66-815 Wanini St
- 66-342 Aukai Ln Unit 1
- 68-46 Apuhihi St Unit B
- 68-091 Au St Unit A
- 68-078 Au St Unit 203