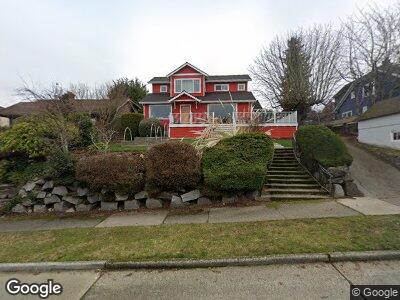
6746 41st Ave SW Seattle, WA 98136
Gatewood NeighborhoodEstimated Value: $1,052,000 - $1,321,000
3
Beds
1
Bath
1,390
Sq Ft
$852/Sq Ft
Est. Value
About This Home
This home is located at 6746 41st Ave SW, Seattle, WA 98136 and is currently estimated at $1,184,792, approximately $852 per square foot. 6746 41st Ave SW is a home located in King County with nearby schools including Madison Middle School, West Seattle High School, and Our Lady of Guadalupe Catholic School.
Ownership History
Date
Name
Owned For
Owner Type
Purchase Details
Closed on
Sep 24, 2024
Sold by
Lapsa Andrew P and Lapsa Katie A
Bought by
Andrew And Katie Lapsa Living Trust and Lapsa
Current Estimated Value
Purchase Details
Closed on
Dec 11, 2009
Sold by
Ps Stephen M Waltar
Bought by
Lapsa Andrew P and Lapsa Katie A
Home Financials for this Owner
Home Financials are based on the most recent Mortgage that was taken out on this home.
Original Mortgage
$500,762
Interest Rate
4.91%
Mortgage Type
FHA
Purchase Details
Closed on
May 5, 2009
Sold by
Pitts Robert H
Bought by
Pitts Robert H
Purchase Details
Closed on
May 23, 2002
Sold by
Pitts Robert H
Bought by
Pitts Robert H
Create a Home Valuation Report for This Property
The Home Valuation Report is an in-depth analysis detailing your home's value as well as a comparison with similar homes in the area
Home Values in the Area
Average Home Value in this Area
Purchase History
| Date | Buyer | Sale Price | Title Company |
|---|---|---|---|
| Andrew And Katie Lapsa Living Trust | $313 | None Listed On Document | |
| Andrew And Katie Lapsa Living Trust | $313 | None Listed On Document | |
| Lapsa Andrew P | $510,000 | Chicago Title | |
| Pitts Robert H | -- | None Available | |
| Pitts Robert H | -- | -- |
Source: Public Records
Mortgage History
| Date | Status | Borrower | Loan Amount |
|---|---|---|---|
| Previous Owner | Lapsa Andrew F | $150,000 | |
| Previous Owner | Lapsa Andrew P | $430,900 | |
| Previous Owner | Lapsa Andrew P | $441,000 | |
| Previous Owner | Lapsa Andrew P | $460,000 | |
| Previous Owner | Lapsa Andrew P | $500,762 |
Source: Public Records
Tax History Compared to Growth
Tax History
| Year | Tax Paid | Tax Assessment Tax Assessment Total Assessment is a certain percentage of the fair market value that is determined by local assessors to be the total taxable value of land and additions on the property. | Land | Improvement |
|---|---|---|---|---|
| 2024 | $11,946 | $1,151,000 | $982,000 | $169,000 |
| 2023 | $9,653 | $911,000 | $648,000 | $263,000 |
| 2022 | $8,516 | $967,000 | $554,000 | $413,000 |
| 2021 | $8,176 | $823,000 | $478,000 | $345,000 |
| 2020 | $8,099 | $753,000 | $437,000 | $316,000 |
| 2018 | $7,887 | $751,000 | $436,000 | $315,000 |
| 2017 | $6,732 | $726,000 | $426,000 | $300,000 |
| 2016 | $6,475 | $635,000 | $375,000 | $260,000 |
| 2015 | $5,312 | $600,000 | $356,000 | $244,000 |
| 2014 | -- | $520,000 | $311,000 | $209,000 |
| 2013 | -- | $466,000 | $278,000 | $188,000 |
Source: Public Records
Map
Nearby Homes
- 6914 Heights Place SW
- 6905 39th Ave SW
- 6960 California Ave SW Unit A-208
- 4221 SW Myrtle St
- 4223 SW Myrtle St
- 6507 41st Ave SW
- 6554 44th Ave SW
- 6550 44th Ave SW
- 6544 44th Ave SW
- 4351 SW Willow St
- 4321 SW Beveridge Place
- 7333 39th Ave SW
- 6537 35th Ave SW
- 8014 &8018 45th Ave SW
- 6040 42nd Ave SW
- 5435 California Ave SW
- 6019 Fauntleroy Way SW Unit B
- 6753 47th Ave SW
- 6007 Fauntleroy Way SW Unit B
- 6517 35th Ave SW