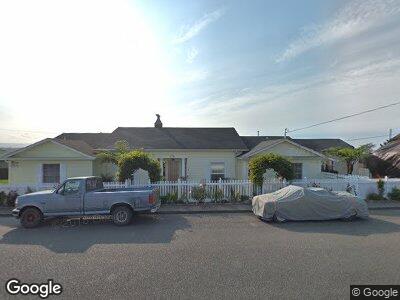
676 Scenic Dr Loleta, CA 95551
Loleta NeighborhoodEstimated Value: $395,000 - $531,000
4
Beds
2
Baths
3,200
Sq Ft
$149/Sq Ft
Est. Value
About This Home
This home is located at 676 Scenic Dr, Loleta, CA 95551 and is currently estimated at $478,067, approximately $149 per square foot. 676 Scenic Dr is a home located in Humboldt County with nearby schools including Loleta Elementary School, East High School, and Fortuna Union High School.
Ownership History
Date
Name
Owned For
Owner Type
Purchase Details
Closed on
Mar 2, 2009
Sold by
Barbata Charles G
Bought by
Barbata Charles G
Current Estimated Value
Purchase Details
Closed on
Apr 28, 2005
Sold by
Barbata Charles Gregory
Bought by
Barbata Charles G
Purchase Details
Closed on
Aug 21, 2004
Sold by
Barbata Cheryl
Bought by
Barbata Charles Gregory
Home Financials for this Owner
Home Financials are based on the most recent Mortgage that was taken out on this home.
Original Mortgage
$375,000
Outstanding Balance
$197,522
Interest Rate
5.8%
Mortgage Type
Purchase Money Mortgage
Estimated Equity
$397,314
Purchase Details
Closed on
Aug 12, 2004
Sold by
Samuelson Kenneth B
Bought by
Barbata Charles Gregory
Home Financials for this Owner
Home Financials are based on the most recent Mortgage that was taken out on this home.
Original Mortgage
$375,000
Outstanding Balance
$197,522
Interest Rate
5.8%
Mortgage Type
Purchase Money Mortgage
Estimated Equity
$397,314
Create a Home Valuation Report for This Property
The Home Valuation Report is an in-depth analysis detailing your home's value as well as a comparison with similar homes in the area
Home Values in the Area
Average Home Value in this Area
Purchase History
| Date | Buyer | Sale Price | Title Company |
|---|---|---|---|
| Barbata Charles G | -- | None Available | |
| Barbata Charles G | -- | -- | |
| Barbata Charles Gregory | -- | First American Title Ins Co | |
| Barbata Charles Gregory | $475,000 | First American Title Ins Co |
Source: Public Records
Mortgage History
| Date | Status | Borrower | Loan Amount |
|---|---|---|---|
| Open | Barbata Charles G | $150,000 | |
| Closed | Barbata Charles Gregory | $76,000 | |
| Open | Barbata Charles Gregory | $375,000 | |
| Previous Owner | Samuelson Kenneth B | $101,700 |
Source: Public Records
Tax History Compared to Growth
Tax History
| Year | Tax Paid | Tax Assessment Tax Assessment Total Assessment is a certain percentage of the fair market value that is determined by local assessors to be the total taxable value of land and additions on the property. | Land | Improvement |
|---|---|---|---|---|
| 2024 | $4,963 | $350,000 | $115,000 | $235,000 |
| 2023 | $4,797 | $350,000 | $115,000 | $235,000 |
| 2022 | $4,488 | $350,000 | $115,000 | $235,000 |
| 2021 | $4,484 | $350,000 | $115,000 | $235,000 |
| 2020 | $4,373 | $337,631 | $115,000 | $222,631 |
| 2019 | $4,085 | $337,631 | $115,000 | $222,631 |
| 2018 | $4,072 | $337,631 | $115,000 | $222,631 |
| 2017 | $4,217 | $350,000 | $115,000 | $235,000 |
| 2016 | $4,221 | $350,000 | $115,000 | $235,000 |
| 2015 | -- | $350,000 | $115,000 | $235,000 |
| 2014 | -- | $540,110 | $227,413 | $312,697 |
Source: Public Records
Map
Nearby Homes
- 646 Main St
- 849 Perrott Ave
- 135 Clough Rd
- 830 Eel River Dr
- 1652 Tompkins Hill Rd
- 1295 Palmer Blvd
- 381 Palmer Blvd
- 1651 Port Kenyon Rd
- 1282 Madison St
- 1700 Clay Ave
- 857 7th St
- 645 7th St
- 1794 Carson Woods Rd
- 310 Arlington Ave
- 912 13th St
- 835 Main St
- 650 Fern Street Ave
- 410 11th St
- 1049 I St
- 7785 Torgersen Rd