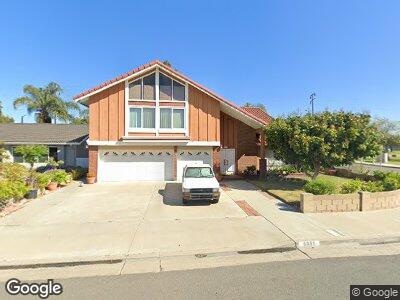
6851 Red Coach Dr Huntington Beach, CA 92647
Estimated Value: $1,513,501 - $1,719,000
4
Beds
3
Baths
2,938
Sq Ft
$539/Sq Ft
Est. Value
About This Home
This home is located at 6851 Red Coach Dr, Huntington Beach, CA 92647 and is currently estimated at $1,583,125, approximately $538 per square foot. 6851 Red Coach Dr is a home located in Orange County with nearby schools including Circle View Elementary School, Spring View Middle School, and Marina High School.
Ownership History
Date
Name
Owned For
Owner Type
Purchase Details
Closed on
Nov 4, 2022
Sold by
Le Lai and Le Dan Thi
Bought by
2022 Le Tran Family Trust
Current Estimated Value
Purchase Details
Closed on
Jun 23, 2003
Sold by
Le Lai and Tran Dan Thi
Bought by
Le Lai and Tran Dan Thi
Home Financials for this Owner
Home Financials are based on the most recent Mortgage that was taken out on this home.
Original Mortgage
$60,000
Interest Rate
5.17%
Mortgage Type
Credit Line Revolving
Purchase Details
Closed on
Oct 30, 2001
Sold by
Maikowski Matthew J
Bought by
Le Lai and Tran Dan Thi
Home Financials for this Owner
Home Financials are based on the most recent Mortgage that was taken out on this home.
Original Mortgage
$368,000
Interest Rate
7.01%
Purchase Details
Closed on
Mar 15, 2001
Sold by
Maikowski Matthew J
Bought by
Maikowski Matthew J
Purchase Details
Closed on
Jan 15, 2001
Sold by
Maikowski Hub J and Maikowski Audrey A
Bought by
Maikowski Audrey A
Create a Home Valuation Report for This Property
The Home Valuation Report is an in-depth analysis detailing your home's value as well as a comparison with similar homes in the area
Home Values in the Area
Average Home Value in this Area
Purchase History
| Date | Buyer | Sale Price | Title Company |
|---|---|---|---|
| 2022 Le Tran Family Trust | -- | -- | |
| Le Lai | -- | -- | |
| Le Lai | -- | First American Title Co | |
| Le Lai | $460,000 | First American Title Co | |
| Maikowski Matthew J | -- | -- |
Source: Public Records
Mortgage History
| Date | Status | Borrower | Loan Amount |
|---|---|---|---|
| Previous Owner | Le Lai | $328,000 | |
| Previous Owner | Le Lai | $268,100 | |
| Previous Owner | Le Lai | $250,000 | |
| Previous Owner | Le Lai | $60,000 | |
| Previous Owner | Le Lai | $322,700 | |
| Previous Owner | Le Lai | $377,600 | |
| Previous Owner | Le Lai | $368,000 |
Source: Public Records
Tax History Compared to Growth
Tax History
| Year | Tax Paid | Tax Assessment Tax Assessment Total Assessment is a certain percentage of the fair market value that is determined by local assessors to be the total taxable value of land and additions on the property. | Land | Improvement |
|---|---|---|---|---|
| 2024 | $7,621 | $660,123 | $444,582 | $215,541 |
| 2023 | $7,449 | $647,180 | $435,865 | $211,315 |
| 2022 | $7,264 | $634,491 | $427,319 | $207,172 |
| 2021 | $7,130 | $622,050 | $418,940 | $203,110 |
| 2020 | $7,050 | $615,672 | $414,644 | $201,028 |
| 2019 | $6,926 | $603,600 | $406,513 | $197,087 |
| 2018 | $6,769 | $591,765 | $398,542 | $193,223 |
| 2017 | $6,660 | $580,162 | $390,727 | $189,435 |
| 2016 | $6,385 | $568,787 | $383,066 | $185,721 |
| 2015 | $6,288 | $560,244 | $377,312 | $182,932 |
| 2014 | $6,163 | $549,270 | $369,921 | $179,349 |
Source: Public Records
Map
Nearby Homes
- 15551 Sunburst Ln
- 15461 Victoria Ln
- 15562 Placid Cir
- 15801 Wicklow Ln
- 7322 Judson Ave
- 15352 Stanford Ln
- 16032 Marjan Ln
- 15832 Standish Ln
- 15052 Columbia Ln
- 15882 Pilgrim Cir
- 7122 Bluesails Dr
- 6151 Tyndall Dr
- 0 NE Heil Unit OC25049488
- 7042 Stonewood Dr
- 16001 Ballantine Ln
- 15302 Shasta Ln
- 6372 Larchwood Dr
- 21446 Mar Vista Dr
- 21396 Mar Vista Dr
- 7736 Sugar Dr