6857 Bellgreen Dr Houston, TX 77030
University Place NeighborhoodEstimated Value: $524,288 - $785,000
3
Beds
3
Baths
2,125
Sq Ft
$320/Sq Ft
Est. Value
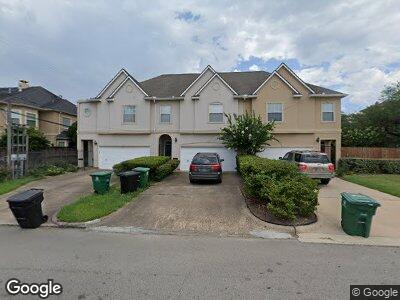
About This Home
This home is located at 6857 Bellgreen Dr, Houston, TX 77030 and is currently estimated at $680,072, approximately $320 per square foot. 6857 Bellgreen Dr is a home located in Harris County with nearby schools including Roberts Elementary School, Pershing Middle School, and Lamar High School.
Ownership History
Date
Name
Owned For
Owner Type
Purchase Details
Closed on
Jul 24, 2020
Sold by
Zhongde Realty Llc
Bought by
Li Miai and Wu May
Current Estimated Value
Purchase Details
Closed on
Feb 28, 2005
Sold by
Shannon Michael A
Bought by
Li Miao and Wu Xuemei
Home Financials for this Owner
Home Financials are based on the most recent Mortgage that was taken out on this home.
Original Mortgage
$189,000
Interest Rate
5.71%
Mortgage Type
Purchase Money Mortgage
Purchase Details
Closed on
Feb 8, 2005
Sold by
Shannon Michael W and Shannon Elvira V
Bought by
Shannon Michael A and Shannon Samantha Jane
Home Financials for this Owner
Home Financials are based on the most recent Mortgage that was taken out on this home.
Original Mortgage
$189,000
Interest Rate
5.71%
Mortgage Type
Purchase Money Mortgage
Purchase Details
Closed on
Jul 5, 1996
Sold by
Robert Moorman Inc
Bought by
Shannon Michael W and Shannon Elvira V
Home Financials for this Owner
Home Financials are based on the most recent Mortgage that was taken out on this home.
Original Mortgage
$162,850
Interest Rate
8.05%
Create a Home Valuation Report for This Property
The Home Valuation Report is an in-depth analysis detailing your home's value as well as a comparison with similar homes in the area
Home Values in the Area
Average Home Value in this Area
Purchase History
| Date | Buyer | Sale Price | Title Company |
|---|---|---|---|
| Li Miai | -- | None Available | |
| Li Miao | -- | Chicago Title Insurance Co | |
| Shannon Michael A | -- | Chicago Title Insurance Co | |
| Shannon Michael W | -- | Chicago Title |
Source: Public Records
Mortgage History
| Date | Status | Borrower | Loan Amount |
|---|---|---|---|
| Previous Owner | Li Miao | $189,000 | |
| Previous Owner | Shannon Michael A | $189,000 | |
| Previous Owner | Shannon Michael W | $157,086 | |
| Previous Owner | Shannon Michael W | $162,850 |
Source: Public Records
Tax History Compared to Growth
Tax History
| Year | Tax Paid | Tax Assessment Tax Assessment Total Assessment is a certain percentage of the fair market value that is determined by local assessors to be the total taxable value of land and additions on the property. | Land | Improvement |
|---|---|---|---|---|
| 2023 | $6,896 | $458,600 | $199,132 | $259,468 |
| 2022 | $9,600 | $436,000 | $199,132 | $236,868 |
| 2021 | $10,178 | $436,704 | $199,132 | $237,572 |
| 2020 | $10,413 | $430,000 | $199,132 | $230,868 |
| 2019 | $10,332 | $408,300 | $171,019 | $237,281 |
| 2018 | $8,194 | $417,600 | $171,019 | $246,581 |
| 2017 | $10,562 | $417,692 | $171,019 | $246,673 |
| 2016 | $10,633 | $443,405 | $171,019 | $272,386 |
| 2015 | $7,004 | $417,071 | $171,019 | $246,052 |
| 2014 | $7,004 | $374,000 | $171,019 | $202,981 |
Source: Public Records
Map
Nearby Homes
- 2215 Sheridan St
- 6825 Bellgreen Dr
- 2209 Macarthur St
- 2127 Mcclendon St
- 2314 Dorrington St Unit C
- 2205 Goldsmith St
- 2348 Sheridan St
- 2326 Wordsworth St
- 2330 Wordsworth St
- 2065 Southgate Blvd
- 2320 Blue Bonnet Blvd
- 2425 Wordsworth St
- 2425 Southgate Blvd
- 2016 Southgate Dr Blvd
- 2018 Southgate Blvd
- 2510 Mcclendon St
- 2429 Goldsmith St
- 7552 Main St
- 2438 Southgate Blvd
- 2430 Goldsmith St