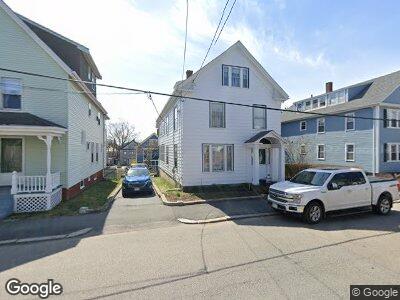
69 Ocean Ave Salem, MA 01970
South Salem NeighborhoodEstimated Value: $675,731 - $915,000
4
Beds
2
Baths
3,010
Sq Ft
$262/Sq Ft
Est. Value
About This Home
This home is located at 69 Ocean Ave, Salem, MA 01970 and is currently estimated at $789,183, approximately $262 per square foot. 69 Ocean Ave is a home located in Essex County with nearby schools including Saltonstall School, Horace Mann Laboratory, and Carlton Elementary School.
Ownership History
Date
Name
Owned For
Owner Type
Purchase Details
Closed on
Jan 1, 1977
Bought by
Moran William B and Moran Gloria J
Current Estimated Value
Create a Home Valuation Report for This Property
The Home Valuation Report is an in-depth analysis detailing your home's value as well as a comparison with similar homes in the area
Home Values in the Area
Average Home Value in this Area
Purchase History
| Date | Buyer | Sale Price | Title Company |
|---|---|---|---|
| Moran William B | $37,500 | -- |
Source: Public Records
Tax History Compared to Growth
Tax History
| Year | Tax Paid | Tax Assessment Tax Assessment Total Assessment is a certain percentage of the fair market value that is determined by local assessors to be the total taxable value of land and additions on the property. | Land | Improvement |
|---|---|---|---|---|
| 2025 | $7,805 | $688,300 | $170,600 | $517,700 |
| 2024 | $7,204 | $620,000 | $161,600 | $458,400 |
| 2023 | $6,952 | $555,700 | $149,600 | $406,100 |
| 2022 | $7,123 | $537,600 | $140,600 | $397,000 |
| 2021 | $6,861 | $497,200 | $140,600 | $356,600 |
| 2020 | $6,560 | $454,000 | $121,500 | $332,500 |
| 2019 | $6,488 | $429,700 | $115,500 | $314,200 |
| 2018 | $5,963 | $387,700 | $110,100 | $277,600 |
| 2017 | $5,537 | $349,100 | $89,800 | $259,300 |
| 2016 | $5,395 | $344,300 | $85,000 | $259,300 |
| 2015 | $5,209 | $317,400 | $76,600 | $240,800 |
Source: Public Records
Map
Nearby Homes
- 26 Linden St
- 275 Lafayette St
- 6R Hazel Terrace Unit 8
- 6R Hazel Terrace Unit 9
- 3 Hazel St
- 323 Lafayette St Unit 3
- 16 Loring Ave
- 21 Hancock St Unit 2
- 5 Gardner St Unit 2
- 106 Broadway Unit 3
- 106 Broadway Unit 2
- 106 Broadway Unit 1
- 12 Savoy Rd
- 101 Leach St Unit 3
- 195 Lafayette St Unit 4
- 52 Jefferson Ave
- 11 Read St Unit 1
- 16 Raymond Rd
- 41 Salem St
- 11 Ropes St