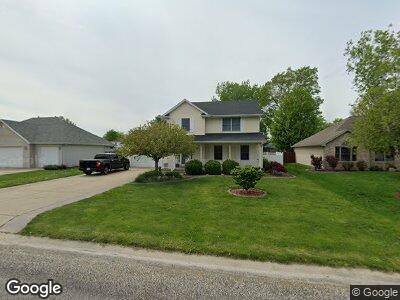
7 Corn Silk Ln Divernon, IL 62530
Estimated Value: $262,000 - $283,106
3
Beds
4
Baths
2,498
Sq Ft
$110/Sq Ft
Est. Value
About This Home
This home is located at 7 Corn Silk Ln, Divernon, IL 62530 and is currently estimated at $275,027, approximately $110 per square foot. 7 Corn Silk Ln is a home located in Sangamon County with nearby schools including Auburn Elementary School, Auburn Middle School, and Auburn Junior High School.
Ownership History
Date
Name
Owned For
Owner Type
Purchase Details
Closed on
Aug 6, 2024
Sold by
Burns Lewis R and Burns Norma Jean
Bought by
Jones James A and Jones Mikhala N
Current Estimated Value
Home Financials for this Owner
Home Financials are based on the most recent Mortgage that was taken out on this home.
Original Mortgage
$251,010
Outstanding Balance
$250,275
Interest Rate
9.63%
Mortgage Type
New Conventional
Estimated Equity
$20,017
Purchase Details
Closed on
Jul 3, 2023
Sold by
Dambacher Scott R and Dambacher Mary T
Bought by
Burns Lewis R and Burns Norma Jean
Home Financials for this Owner
Home Financials are based on the most recent Mortgage that was taken out on this home.
Original Mortgage
$249,375
Interest Rate
6.39%
Mortgage Type
New Conventional
Purchase Details
Closed on
Dec 19, 2003
Create a Home Valuation Report for This Property
The Home Valuation Report is an in-depth analysis detailing your home's value as well as a comparison with similar homes in the area
Home Values in the Area
Average Home Value in this Area
Purchase History
| Date | Buyer | Sale Price | Title Company |
|---|---|---|---|
| Jones James A | $279,000 | None Listed On Document | |
| Burns Lewis R | $262,500 | None Listed On Document | |
| -- | $159,900 | -- |
Source: Public Records
Mortgage History
| Date | Status | Borrower | Loan Amount |
|---|---|---|---|
| Open | Jones James A | $251,010 | |
| Previous Owner | Burns Lewis R | $249,375 |
Source: Public Records
Tax History Compared to Growth
Tax History
| Year | Tax Paid | Tax Assessment Tax Assessment Total Assessment is a certain percentage of the fair market value that is determined by local assessors to be the total taxable value of land and additions on the property. | Land | Improvement |
|---|---|---|---|---|
| 2023 | $5,915 | $87,080 | $9,950 | $77,130 |
| 2022 | $3,890 | $61,029 | $8,916 | $52,113 |
| 2021 | $3,756 | $58,496 | $8,546 | $49,950 |
| 2020 | $3,783 | $56,643 | $8,275 | $48,368 |
| 2019 | $3,926 | $55,674 | $8,133 | $47,541 |
| 2018 | $4,475 | $62,250 | $7,888 | $54,362 |
| 2017 | $4,420 | $60,791 | $7,703 | $53,088 |
| 2016 | $4,321 | $60,548 | $7,672 | $52,876 |
| 2015 | $4,297 | $59,483 | $7,537 | $51,946 |
| 2014 | $4,193 | $58,466 | $7,408 | $51,058 |
| 2013 | $3,872 | $56,543 | $7,164 | $49,379 |
Source: Public Records
Map
Nearby Homes
- 222 W Madison Unit 1
- 127 N 1st St
- 209 Joan Dr Unit 1
- 14594 Dixon Rd Unit 1
- 507 Washington St
- 622 6th St
- 11910 Bubbling Well Rd Unit 1
- 1424 Horse Creek Trail
- 1301 4th St Unit 1
- 60 Covered Bridge Acres
- 406 E Washington St
- 34187 E 6th Rd
- 342 Interurban St
- 511 N 5th St Unit 1
- 716 W Monroe St Unit 1
- 890 W Van Buren St
- 520 N 6th St Unit 1
- 921 W Monroe St Unit 1
- 427 N 10th St
- 000 Virden Rd