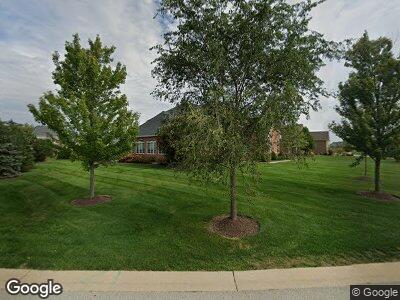
7 Shenandoah Cir Barrington, IL 60010
Southwest Barrington NeighborhoodEstimated Value: $1,213,311 - $1,469,000
4
Beds
4
Baths
3,947
Sq Ft
$350/Sq Ft
Est. Value
About This Home
This home is located at 7 Shenandoah Cir, Barrington, IL 60010 and is currently estimated at $1,381,578, approximately $350 per square foot. 7 Shenandoah Cir is a home with nearby schools including Countryside Elementary School, Barrington Mdle School- Prairie Cmps, and Barrington High School.
Ownership History
Date
Name
Owned For
Owner Type
Purchase Details
Closed on
Oct 21, 2013
Sold by
Toll Il Wsb Lp
Bought by
Calonje German D and Calonje Jolanta
Current Estimated Value
Home Financials for this Owner
Home Financials are based on the most recent Mortgage that was taken out on this home.
Original Mortgage
$877,600
Interest Rate
4.87%
Mortgage Type
New Conventional
Create a Home Valuation Report for This Property
The Home Valuation Report is an in-depth analysis detailing your home's value as well as a comparison with similar homes in the area
Home Values in the Area
Average Home Value in this Area
Purchase History
| Date | Buyer | Sale Price | Title Company |
|---|---|---|---|
| Calonje German D | $975,500 | First American Title |
Source: Public Records
Mortgage History
| Date | Status | Borrower | Loan Amount |
|---|---|---|---|
| Open | Calonje German D | $360,000 | |
| Open | Calonje German D | $748,000 | |
| Closed | Calonje German D | $88,900 | |
| Closed | Calonje German D | $877,600 |
Source: Public Records
Tax History Compared to Growth
Tax History
| Year | Tax Paid | Tax Assessment Tax Assessment Total Assessment is a certain percentage of the fair market value that is determined by local assessors to be the total taxable value of land and additions on the property. | Land | Improvement |
|---|---|---|---|---|
| 2024 | $23,164 | $95,861 | $20,829 | $75,032 |
| 2023 | $23,164 | $95,861 | $20,829 | $75,032 |
| 2022 | $23,164 | $100,164 | $20,829 | $79,335 |
| 2021 | $19,868 | $76,343 | $8,926 | $67,417 |
| 2020 | $19,318 | $76,343 | $8,926 | $67,417 |
| 2019 | $18,913 | $84,826 | $8,926 | $75,900 |
| 2018 | $21,289 | $92,845 | $8,182 | $84,663 |
| 2017 | $20,782 | $92,845 | $8,182 | $84,663 |
| 2016 | $19,606 | $92,845 | $8,182 | $84,663 |
| 2015 | $21,436 | $94,272 | $7,439 | $86,833 |
| 2014 | $18,029 | $79,598 | $7,439 | $72,159 |
| 2013 | $1,609 | $7,439 | $7,439 | $0 |
Source: Public Records
Map
Nearby Homes