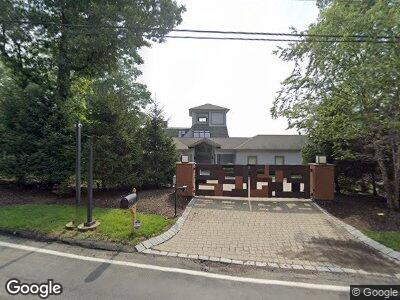
7 Tweed Blvd Nyack, NY 10960
Upper Grandview NeighborhoodEstimated Value: $3,253,000 - $3,606,000
4
Beds
5
Baths
4,772
Sq Ft
$715/Sq Ft
Est. Value
About This Home
This home is located at 7 Tweed Blvd, Nyack, NY 10960 and is currently estimated at $3,411,602, approximately $714 per square foot. 7 Tweed Blvd is a home located in Rockland County with nearby schools including Nyack Senior High School.
Ownership History
Date
Name
Owned For
Owner Type
Purchase Details
Closed on
Dec 9, 2016
Sold by
Santos Anthony
Bought by
Santos Anthony and Anthony Santos Revocable Trust
Current Estimated Value
Purchase Details
Closed on
Dec 31, 2010
Sold by
Smk Home Builders Inc
Bought by
Santos Anthony
Home Financials for this Owner
Home Financials are based on the most recent Mortgage that was taken out on this home.
Original Mortgage
$660,000
Outstanding Balance
$452,204
Interest Rate
4.5%
Mortgage Type
FHA
Estimated Equity
$2,959,398
Purchase Details
Closed on
Sep 25, 2009
Sold by
Jhnson Jeanne H
Bought by
Smk Home Builders Inc
Home Financials for this Owner
Home Financials are based on the most recent Mortgage that was taken out on this home.
Original Mortgage
$338,000
Interest Rate
5.14%
Mortgage Type
Purchase Money Mortgage
Purchase Details
Closed on
Aug 20, 1998
Sold by
Johnson Jeanne H
Bought by
Johnson Fletcher J and Johnson Jeanne H
Create a Home Valuation Report for This Property
The Home Valuation Report is an in-depth analysis detailing your home's value as well as a comparison with similar homes in the area
Home Values in the Area
Average Home Value in this Area
Purchase History
| Date | Buyer | Sale Price | Title Company |
|---|---|---|---|
| Santos Anthony | -- | None Available | |
| Santos Anthony | $2,660,000 | None Available | |
| Smk Home Builders Inc | $675,000 | Robert Knoebel | |
| Smk Home Builders Inc | $675,000 | The Judicial Title Insurance | |
| Johnson Fletcher J | -- | Chicago Title Insurance Co |
Source: Public Records
Mortgage History
| Date | Status | Borrower | Loan Amount |
|---|---|---|---|
| Open | Santos Anthony | $660,000 | |
| Previous Owner | Smk Home Builders Inc | $338,000 | |
| Previous Owner | Johnson Md Fletcher J | $420,000 |
Source: Public Records
Tax History Compared to Growth
Tax History
| Year | Tax Paid | Tax Assessment Tax Assessment Total Assessment is a certain percentage of the fair market value that is determined by local assessors to be the total taxable value of land and additions on the property. | Land | Improvement |
|---|---|---|---|---|
| 2023 | $57,820 | $690,500 | $228,700 | $461,800 |
| 2022 | $50,288 | $690,500 | $228,700 | $461,800 |
| 2021 | $50,288 | $690,500 | $228,700 | $461,800 |
| 2020 | $52,187 | $690,500 | $228,700 | $461,800 |
| 2019 | $16,070 | $690,500 | $228,700 | $461,800 |
| 2018 | $49,961 | $690,500 | $228,700 | $461,800 |
| 2017 | $49,376 | $690,500 | $228,700 | $461,800 |
| 2016 | $46,134 | $672,900 | $228,700 | $444,200 |
| 2015 | -- | $672,900 | $228,700 | $444,200 |
| 2014 | -- | $672,900 | $228,700 | $444,200 |
Source: Public Records
Map
Nearby Homes
- 1090 Route 9w S
- 67 River Rd
- 1028 Route 9w S
- 87 River Rd
- 71 Old Mountain Rd S
- 1021 Route 9w S
- 19 Shadyside Ave
- 3 Salisbury Point Unit 4B
- 3 Salisbury Point Unit 6B
- 936 Route 9w S
- 938 Route 9w S
- 2 Salisbury Point Unit 5E
- 2 Salisbury Point Unit 1D
- 934 Route 9w S
- 921 Route 9w S
- 7 Berachah Ave
- 2 Washington Ave
- 97 Clinton Ave
- 27 Terrace Dr
- 62 Brookside Ave