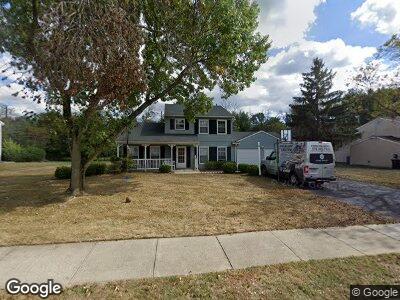
70 Parker Rd S Plainsboro Township, NJ 08536
Plainsboro Township NeighborhoodEstimated Value: $440,000 - $816,000
3
Beds
3
Baths
1,755
Sq Ft
$371/Sq Ft
Est. Value
About This Home
This home is located at 70 Parker Rd S, Plainsboro Township, NJ 08536 and is currently estimated at $650,267, approximately $370 per square foot. 70 Parker Rd S is a home located in Middlesex County with nearby schools including John V.B. Wicoff Elementary School, Millstone River School, and Community Middle School.
Ownership History
Date
Name
Owned For
Owner Type
Purchase Details
Closed on
Jul 5, 2021
Sold by
Kaleem Awo K and Kaleem Hassan
Bought by
Ramnarine Nandanie
Current Estimated Value
Home Financials for this Owner
Home Financials are based on the most recent Mortgage that was taken out on this home.
Original Mortgage
$470,250
Interest Rate
2.7%
Mortgage Type
New Conventional
Purchase Details
Closed on
Oct 28, 2002
Sold by
Soto Janet
Bought by
Souriac Nesly and Souriac Magadalena
Home Financials for this Owner
Home Financials are based on the most recent Mortgage that was taken out on this home.
Original Mortgage
$308,750
Interest Rate
6.17%
Purchase Details
Closed on
Dec 3, 1998
Sold by
Cuffman Curtis
Bought by
Soto Janet and Plussh Helen
Home Financials for this Owner
Home Financials are based on the most recent Mortgage that was taken out on this home.
Original Mortgage
$120,000
Interest Rate
6.85%
Create a Home Valuation Report for This Property
The Home Valuation Report is an in-depth analysis detailing your home's value as well as a comparison with similar homes in the area
Home Values in the Area
Average Home Value in this Area
Purchase History
| Date | Buyer | Sale Price | Title Company |
|---|---|---|---|
| Ramnarine Nandanie | $495,000 | Guardian Setmnt Agents Inc | |
| Souriac Nesly | $325,000 | -- | |
| Soto Janet | $200,000 | -- |
Source: Public Records
Mortgage History
| Date | Status | Borrower | Loan Amount |
|---|---|---|---|
| Previous Owner | Ramnarine Nandanie | $470,250 | |
| Previous Owner | Kaleem Hassan | $326,000 | |
| Previous Owner | Kaleem Hassan | $298,500 | |
| Previous Owner | Souriac Nesly | $308,750 | |
| Previous Owner | Soto Janet | $120,000 |
Source: Public Records
Tax History Compared to Growth
Tax History
| Year | Tax Paid | Tax Assessment Tax Assessment Total Assessment is a certain percentage of the fair market value that is determined by local assessors to be the total taxable value of land and additions on the property. | Land | Improvement |
|---|---|---|---|---|
| 2024 | $11,465 | $449,600 | $189,400 | $260,200 |
| 2023 | $11,465 | $449,600 | $189,400 | $260,200 |
| 2022 | $11,289 | $449,600 | $189,400 | $260,200 |
| 2021 | $9,693 | $441,500 | $189,400 | $252,100 |
| 2020 | $9,912 | $414,400 | $189,400 | $225,000 |
| 2019 | $9,693 | $414,400 | $189,400 | $225,000 |
| 2018 | $9,477 | $414,400 | $189,400 | $225,000 |
| 2017 | $9,208 | $414,400 | $189,400 | $225,000 |
| 2016 | $8,802 | $414,400 | $189,400 | $225,000 |
| 2015 | $9,150 | $362,500 | $168,600 | $193,900 |
| 2014 | $9,059 | $362,500 | $168,600 | $193,900 |
Source: Public Records
Map
Nearby Homes
- 75 Parker Rd
- 5 Gulick Ln
- 2 Chandler Ct
- 12 Titus Ln
- 4 Cottonwood Ct
- 5801 Schindler Dr S
- 7 Mount Dr Unit 4
- 4 Brewer Way Unit 11
- 1 Flemmer Ct
- 5 Flemmer Ct
- 3 Flemmer Ct
- 27 Brewer Way
- 10 Mount Dr
- 19 Brewer Way
- 10 Mount Dr
- 10 Mount Dr
- 17 Brewer Way Unit 44
- 4 Flemmer Ct Unit 17
- 19 Brewer Way Unit 43
- 6 Flemmer Ct Unit 18