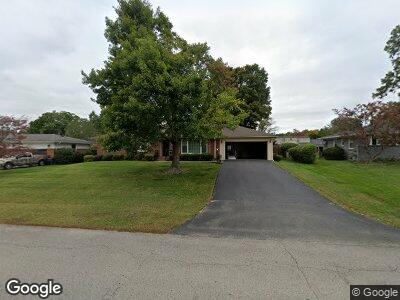
7003 Graymoor Rd Louisville, KY 40222
Graymoor-Devondale NeighborhoodEstimated Value: $335,997 - $423,000
--
Bed
2
Baths
1,687
Sq Ft
$224/Sq Ft
Est. Value
About This Home
This home is located at 7003 Graymoor Rd, Louisville, KY 40222 and is currently estimated at $378,499, approximately $224 per square foot. 7003 Graymoor Rd is a home located in Jefferson County with nearby schools including Wilder Elementary School, Dunn Elementary School, and Norton Elementary School.
Ownership History
Date
Name
Owned For
Owner Type
Purchase Details
Closed on
Dec 28, 2023
Sold by
Hipps Mae Carson Sawyer and Hipps Margaret Mae
Bought by
Thompson Carole C
Current Estimated Value
Create a Home Valuation Report for This Property
The Home Valuation Report is an in-depth analysis detailing your home's value as well as a comparison with similar homes in the area
Home Values in the Area
Average Home Value in this Area
Tax History Compared to Growth
Tax History
| Year | Tax Paid | Tax Assessment Tax Assessment Total Assessment is a certain percentage of the fair market value that is determined by local assessors to be the total taxable value of land and additions on the property. | Land | Improvement |
|---|---|---|---|---|
| 2024 | $3,239 | $290,480 | $75,000 | $215,480 |
| 2023 | $3,335 | $290,480 | $75,000 | $215,480 |
| 2022 | $2,880 | $247,590 | $34,000 | $213,590 |
| 2021 | $2,579 | $247,590 | $34,000 | $213,590 |
| 2020 | $2,410 | $247,590 | $34,000 | $213,590 |
| 2019 | $2,362 | $247,590 | $34,000 | $213,590 |
| 2018 | $2,353 | $247,590 | $34,000 | $213,590 |
| 2017 | $2,204 | $247,590 | $34,000 | $213,590 |
| 2013 | $1,985 | $198,450 | $34,000 | $164,450 |
Source: Public Records
Map
Nearby Homes
- 4833 Westport Rd
- 1123 Girard Dr
- 4825 Westmar Terrace Unit 201
- 4825 Westmar Terrace Unit 101
- 1000 Washburn Ave
- 7505 Moredale Rd
- 1260 Westlynne Way
- 1342 Herr Ln
- 1239 Westlynne Way Unit 1
- 1328 Lynmar Dr Unit 5
- 1328 Lynmar Dr Unit 8
- 2711 Alia Cir
- 2412 Hayward Rd
- 2303 Maria Ct
- 901 Fenley Ave
- 734 Waterford Rd
- 1602 Applewood Ln
- 610 Fenley Ave
- 620 Virginia Ave
- 605 E Kentucky St