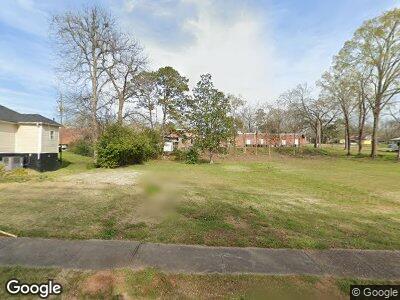
703 Jefferson St Lagrange, GA 30240
Estimated Value: $272,000
1
Bed
1
Bath
384
Sq Ft
$708/Sq Ft
Est. Value
About This Home
This home is located at 703 Jefferson St, Lagrange, GA 30240 and is currently priced at $272,000, approximately $708 per square foot. 703 Jefferson St is a home located in Troup County with nearby schools including Ethel W. Kight Elementary School, Hollis Hand Elementary School, and Franklin Forest Elementary School.
Ownership History
Date
Name
Owned For
Owner Type
Purchase Details
Closed on
Oct 28, 2024
Sold by
Dash For Lagrange Inc
Bought by
Parker Kevin P
Current Estimated Value
Purchase Details
Closed on
Mar 1, 2016
Sold by
Hyatt Christopher D
Bought by
Dash For Lagrange Inc
Purchase Details
Closed on
Dec 3, 2014
Sold by
Yaughn Paul A
Bought by
Hyatt Christopher D and Hyatt Caitlin A
Purchase Details
Closed on
Oct 25, 2010
Sold by
Yaughn James Chester
Bought by
Yaughn Paul A
Home Financials for this Owner
Home Financials are based on the most recent Mortgage that was taken out on this home.
Original Mortgage
$15,000
Interest Rate
4.38%
Mortgage Type
New Conventional
Purchase Details
Closed on
Oct 25, 1989
Sold by
Yaughn Betty J
Bought by
Hanners Betty J
Purchase Details
Closed on
Aug 14, 1970
Sold by
Hardy Thomas R
Bought by
Yaughn Betty J
Purchase Details
Closed on
Mar 1, 1959
Sold by
Whatley Wilbur
Bought by
Hardy Thomas R
Create a Home Valuation Report for This Property
The Home Valuation Report is an in-depth analysis detailing your home's value as well as a comparison with similar homes in the area
Home Values in the Area
Average Home Value in this Area
Purchase History
| Date | Buyer | Sale Price | Title Company |
|---|---|---|---|
| Parker Kevin P | -- | -- | |
| Dash For Lagrange Inc | $50,000 | -- | |
| Hyatt Christopher D | $20,000 | -- | |
| Yaughn Paul A | $20,000 | -- | |
| Hanners Betty J | -- | -- | |
| Yaughn Betty J | $800 | -- | |
| Hardy Thomas R | -- | -- |
Source: Public Records
Mortgage History
| Date | Status | Borrower | Loan Amount |
|---|---|---|---|
| Previous Owner | Yaughn Paul A | $15,000 |
Source: Public Records
Tax History Compared to Growth
Tax History
| Year | Tax Paid | Tax Assessment Tax Assessment Total Assessment is a certain percentage of the fair market value that is determined by local assessors to be the total taxable value of land and additions on the property. | Land | Improvement |
|---|---|---|---|---|
| 2023 | $97 | $3,560 | $3,560 | $0 |
| 2022 | $99 | $3,560 | $3,560 | $0 |
| 2021 | $107 | $3,560 | $3,560 | $0 |
| 2020 | $107 | $3,560 | $3,560 | $0 |
| 2019 | $107 | $3,560 | $3,560 | $0 |
| 2018 | $107 | $3,560 | $3,560 | $0 |
| 2017 | $350 | $14,172 | $3,560 | $10,612 |
| 2016 | $457 | $15,151 | $3,652 | $11,499 |
| 2015 | $242 | $8,000 | $1,891 | $6,109 |
| 2014 | $639 | $21,111 | $3,632 | $17,479 |
| 2013 | -- | $22,374 | $3,632 | $18,742 |
Source: Public Records