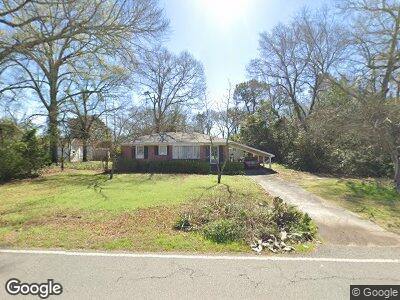
707 Lumpkin St Thomson, GA 30824
Estimated Value: $106,000 - $175,000
3
Beds
1
Bath
1,155
Sq Ft
$123/Sq Ft
Est. Value
About This Home
This home is located at 707 Lumpkin St, Thomson, GA 30824 and is currently estimated at $141,792, approximately $122 per square foot. 707 Lumpkin St is a home with nearby schools including Thomson High School and Briarwood Academy.
Ownership History
Date
Name
Owned For
Owner Type
Purchase Details
Closed on
Oct 13, 1973
Bought by
Hobbs James L
Current Estimated Value
Create a Home Valuation Report for This Property
The Home Valuation Report is an in-depth analysis detailing your home's value as well as a comparison with similar homes in the area
Home Values in the Area
Average Home Value in this Area
Purchase History
| Date | Buyer | Sale Price | Title Company |
|---|---|---|---|
| Hobbs James L | -- | -- |
Source: Public Records
Tax History Compared to Growth
Tax History
| Year | Tax Paid | Tax Assessment Tax Assessment Total Assessment is a certain percentage of the fair market value that is determined by local assessors to be the total taxable value of land and additions on the property. | Land | Improvement |
|---|---|---|---|---|
| 2024 | $905 | $47,238 | $4,200 | $43,038 |
| 2023 | $905 | $45,252 | $4,000 | $41,252 |
| 2022 | $698 | $39,676 | $3,200 | $36,476 |
| 2021 | $442 | $32,402 | $4,000 | $28,402 |
| 2020 | $296 | $27,501 | $5,556 | $21,945 |
| 2019 | $299 | $27,501 | $5,556 | $21,945 |
| 2018 | $304 | $27,501 | $5,556 | $21,945 |
| 2017 | $292 | $27,501 | $5,556 | $21,945 |
| 2016 | $503 | $26,453 | $4,803 | $21,650 |
| 2015 | $435 | $26,452 | $4,803 | $21,650 |
| 2014 | $436 | $26,453 | $4,803 | $21,650 |
| 2013 | -- | $26,452 | $4,803 | $21,649 |
Source: Public Records
Map
Nearby Homes