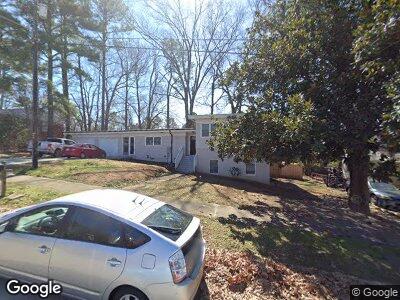
708 Calloway Dr Raleigh, NC 27610
Walnut Creek NeighborhoodEstimated Value: $330,000 - $392,000
3
Beds
3
Baths
1,642
Sq Ft
$219/Sq Ft
Est. Value
About This Home
This home is located at 708 Calloway Dr, Raleigh, NC 27610 and is currently estimated at $360,340, approximately $219 per square foot. 708 Calloway Dr is a home located in Wake County with nearby schools including Fuller Elementary, Leroy Martin Magnet, and Broughton Magnet High School.
Ownership History
Date
Name
Owned For
Owner Type
Purchase Details
Closed on
Feb 11, 2021
Sold by
Chavez Walter Efrain and Chavez Elena Cornejo
Bought by
Silveira Geraldo Magela
Current Estimated Value
Home Financials for this Owner
Home Financials are based on the most recent Mortgage that was taken out on this home.
Original Mortgage
$242,500
Outstanding Balance
$219,995
Interest Rate
2.6%
Mortgage Type
New Conventional
Estimated Equity
$130,659
Purchase Details
Closed on
Aug 2, 2007
Sold by
Federal National Mortgage Association
Bought by
Chavez Walter
Home Financials for this Owner
Home Financials are based on the most recent Mortgage that was taken out on this home.
Original Mortgage
$82,650
Interest Rate
6.65%
Mortgage Type
Purchase Money Mortgage
Purchase Details
Closed on
Mar 30, 2007
Sold by
Thomas James Edward
Bought by
Federal National Mortgage Association
Create a Home Valuation Report for This Property
The Home Valuation Report is an in-depth analysis detailing your home's value as well as a comparison with similar homes in the area
Home Values in the Area
Average Home Value in this Area
Purchase History
| Date | Buyer | Sale Price | Title Company |
|---|---|---|---|
| Silveira Geraldo Magela | $250,000 | None Available | |
| Chavez Walter | -- | None Available | |
| Federal National Mortgage Association | -- | None Available |
Source: Public Records
Mortgage History
| Date | Status | Borrower | Loan Amount |
|---|---|---|---|
| Open | Silveira Geraldo Magela | $242,500 | |
| Previous Owner | Chavez Walter | $82,000 | |
| Previous Owner | Chavez Walter | $82,650 | |
| Previous Owner | Thomas James E | $206,500 |
Source: Public Records
Tax History Compared to Growth
Tax History
| Year | Tax Paid | Tax Assessment Tax Assessment Total Assessment is a certain percentage of the fair market value that is determined by local assessors to be the total taxable value of land and additions on the property. | Land | Improvement |
|---|---|---|---|---|
| 2024 | $3,138 | $359,009 | $89,250 | $269,759 |
| 2023 | $2,672 | $243,283 | $42,500 | $200,783 |
| 2022 | $2,483 | $243,283 | $42,500 | $200,783 |
| 2021 | $2,387 | $243,283 | $42,500 | $200,783 |
| 2020 | $1,547 | $159,877 | $42,500 | $117,377 |
| 2019 | $1,295 | $110,057 | $18,000 | $92,057 |
| 2018 | $1,222 | $110,057 | $18,000 | $92,057 |
| 2017 | $1,165 | $110,057 | $18,000 | $92,057 |
| 2016 | $1,141 | $110,057 | $18,000 | $92,057 |
| 2015 | $1,376 | $130,979 | $26,000 | $104,979 |
| 2014 | -- | $130,979 | $26,000 | $104,979 |
Source: Public Records
Map
Nearby Homes
- 709 Fitzgerald Dr
- 720 Darby St
- 805 Newcombe Rd
- 820 Newcombe Rd
- 1104 Thelonious Dr
- 1112 Kitt Place
- 2006 Waters Dr
- 1100 Hadley Rd
- 1405 Cross Link Rd
- 1410 Cross Link Rd
- 2400 Keith Dr
- 1320 S State St Unit D
- 1521 Cross Link Rd
- 2409 Keith Dr
- 1308 S State St Unit C
- 1317 Garner Rd Unit 101
- 620 Walnut Heights Dr Unit 103
- 620 Walnut Heights Dr Unit 101
- 428 Como Dr
- 1408 Sawyer Rd Unit 101