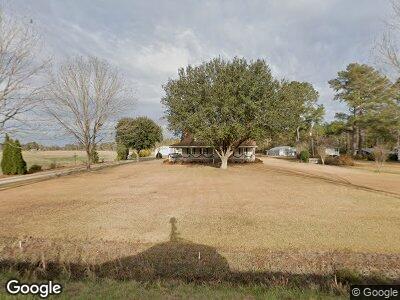
7093 New Britton Hwy E Whiteville, NC 28472
Estimated Value: $258,041 - $434,000
--
Bed
--
Bath
2,340
Sq Ft
$154/Sq Ft
Est. Value
About This Home
This home is located at 7093 New Britton Hwy E, Whiteville, NC 28472 and is currently estimated at $361,010, approximately $154 per square foot. 7093 New Britton Hwy E is a home located in Columbus County.
Ownership History
Date
Name
Owned For
Owner Type
Purchase Details
Closed on
Apr 20, 1982
Bought by
Ward Steven T
Current Estimated Value
Create a Home Valuation Report for This Property
The Home Valuation Report is an in-depth analysis detailing your home's value as well as a comparison with similar homes in the area
Home Values in the Area
Average Home Value in this Area
Purchase History
| Date | Buyer | Sale Price | Title Company |
|---|---|---|---|
| Ward Steven T | -- | -- |
Source: Public Records
Tax History Compared to Growth
Tax History
| Year | Tax Paid | Tax Assessment Tax Assessment Total Assessment is a certain percentage of the fair market value that is determined by local assessors to be the total taxable value of land and additions on the property. | Land | Improvement |
|---|---|---|---|---|
| 2024 | $2,015 | $200,600 | $11,500 | $189,100 |
| 2023 | $2,015 | $200,600 | $11,500 | $189,100 |
| 2022 | $2,015 | $200,600 | $11,500 | $189,100 |
| 2021 | $2,015 | $200,600 | $11,500 | $189,100 |
| 2020 | $1,728 | $168,800 | $11,200 | $157,600 |
| 2019 | $1,728 | $168,800 | $11,200 | $157,600 |
| 2018 | $1,728 | $168,800 | $11,200 | $157,600 |
| 2017 | $1,789 | $168,800 | $11,200 | $157,600 |
| 2016 | $1,802 | $168,800 | $11,200 | $157,600 |
| 2015 | $1,752 | $168,800 | $11,200 | $157,600 |
| 2014 | $1,752 | $168,800 | $11,200 | $157,600 |
Source: Public Records
Map
Nearby Homes
- 711 Soles Rd
- 0000 New Britton Hwy E
- 7960 New Britton Hwy E
- 0 Ward Town Rd N
- 642 Ward Town Rd N
- 111 Pineland Woods Dr
- 178 Pineland Woods Dr Unit D
- 0 Barney Tyler Rd
- 1948 Gores Trailer Rd
- 6370 Honey Hill Rd
- 1948 Antioch Church Rd
- 1834 Harrelsonville Rd
- 1818 Harrelsonville Rd
- 1796 Harrelsonville Rd
- 1244 Arn Ward Rd
- 13.2 Acres Mill Pond
- 13290 New Britton Hwy
- 599 Bitmore Rd
- 5787 James B White Hwy S
- 244 Bitmore Rd