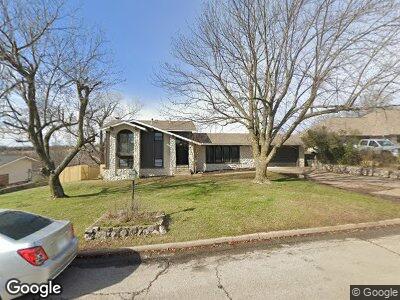
714 Oak Ridge Dr Sand Springs, OK 74063
Estimated Value: $211,000 - $278,000
3
Beds
3
Baths
1,979
Sq Ft
$130/Sq Ft
Est. Value
About This Home
This home is located at 714 Oak Ridge Dr, Sand Springs, OK 74063 and is currently estimated at $257,907, approximately $130 per square foot. 714 Oak Ridge Dr is a home located in Osage County with nearby schools including Northwoods Fine Arts Academy, Garfield STEAM Academy, and Clyde Boyd Middle School.
Ownership History
Date
Name
Owned For
Owner Type
Purchase Details
Closed on
Apr 7, 2025
Sold by
Davis Homes Llc
Bought by
Park Deanna
Current Estimated Value
Purchase Details
Closed on
Oct 1, 2024
Sold by
Black Clifford W and Black Nancy L
Bought by
Davis Homes Llc
Home Financials for this Owner
Home Financials are based on the most recent Mortgage that was taken out on this home.
Original Mortgage
$189,323
Interest Rate
6.35%
Mortgage Type
New Conventional
Purchase Details
Closed on
Nov 9, 2005
Sold by
Household Finance Corp Iii
Bought by
Black Clifford W and Black Nancy L
Purchase Details
Closed on
Jul 1, 2005
Sold by
Carey Paul L
Bought by
Household Finance Corp Iii
Purchase Details
Closed on
May 11, 2000
Sold by
Bauer Robert S
Bought by
Carey Paul and Carey Rebekah
Create a Home Valuation Report for This Property
The Home Valuation Report is an in-depth analysis detailing your home's value as well as a comparison with similar homes in the area
Home Values in the Area
Average Home Value in this Area
Purchase History
| Date | Buyer | Sale Price | Title Company |
|---|---|---|---|
| Park Deanna | $275,000 | Elite Title Services | |
| Davis Homes Llc | $120,000 | Elite Title Services | |
| Black Clifford W | $90,000 | None Available | |
| Household Finance Corp Iii | -- | None Available | |
| Carey Paul | $130,000 | -- |
Source: Public Records
Mortgage History
| Date | Status | Borrower | Loan Amount |
|---|---|---|---|
| Previous Owner | Davis Homes Llc | $189,323 | |
| Previous Owner | Black Clifford W | $72,000 | |
| Previous Owner | Black Clifford W | $48,000 | |
| Closed | Black Clifford W | $0 |
Source: Public Records
Tax History Compared to Growth
Tax History
| Year | Tax Paid | Tax Assessment Tax Assessment Total Assessment is a certain percentage of the fair market value that is determined by local assessors to be the total taxable value of land and additions on the property. | Land | Improvement |
|---|---|---|---|---|
| 2024 | $2,241 | $19,603 | $1,800 | $17,803 |
| 2023 | $2,241 | $19,603 | $1,800 | $17,803 |
| 2022 | $2,139 | $19,603 | $1,800 | $17,803 |
| 2021 | $2,178 | $19,603 | $1,800 | $17,803 |
| 2020 | $2,265 | $19,603 | $1,800 | $17,803 |
| 2019 | $2,205 | $19,603 | $1,800 | $17,803 |
| 2018 | $2,139 | $19,603 | $1,800 | $17,803 |
| 2017 | $2,102 | $19,615 | $1,800 | $17,815 |
| 2016 | $2,110 | $19,244 | $1,800 | $17,444 |
| 2015 | $2,063 | $18,328 | $1,800 | $16,528 |
| 2014 | $1,849 | $17,455 | $1,800 | $15,655 |
| 2013 | $1,761 | $16,624 | $1,800 | $14,824 |
Source: Public Records
Map
Nearby Homes
- 713 Oak Ridge Dr
- 614 Oak Ridge Dr
- 2815 N Mckinley Ave
- 2034 N Wild Mountain Rd
- 226 Fairway Cir
- 224 Fairway Cir
- 122 Osage Ridge Dr
- 18 E Ridgeview Dr
- 2913 N Wild Mountain Rd
- 0 N Oakridge Dr Unit 2439932
- 105 N Osage Ridge Dr E
- 101 Oak Ridge Dr
- 0000 E Old Rd N
- 1302 Old Place N
- 1115 Renaissance Dr
- 0 N Woodland Place
- 1212 E 10th St
- 1012 N Lincoln Ave
- 1212 E 8th St
- 605 N Birch Ave