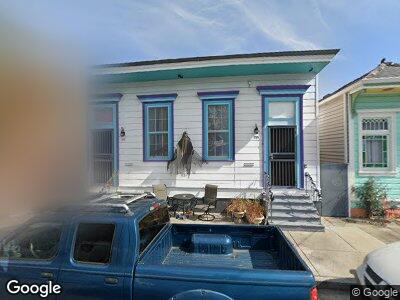
715 Mandeville St New Orleans, LA 70117
Marigny NeighborhoodEstimated Value: $188,000 - $654,000
About This Home
Live on one of the best streets in New Orleans! This lovely two story 2 bed, 2 bath is located in the heart of the Marigny. Freshly painted with newly refurbished original hardwood floors in the living room. With an unbeatable location just minutes from the French Quarter, you'll have the city's best restaurants, bars, and cultural spots right at your doorstep. The Catahoula Collection and orange couch coffee are steps away. Enjoy a shared backyard, gas stove, in unit washer/dryer, large kitchen and dining room. Two bed, one bath upstairs and one bath on the main floor. Don't miss out on this gem in one of New Orleans' most sought-after neighborhoods!
Part of the Catahoula Collection properties. This space is leased on a month-to-month, flexible reservation for short or long term stays. Year lease available as well. Owner pays for water, tenant pays for all other utilities. No smoking. Pets allowed with a pet deposit.
Ownership History
Purchase Details
Home Financials for this Owner
Home Financials are based on the most recent Mortgage that was taken out on this home.Home Values in the Area
Average Home Value in this Area
Purchase History
| Date | Buyer | Sale Price | Title Company |
|---|---|---|---|
| Gossett Deanna C | $250,000 | -- |
Mortgage History
| Date | Status | Borrower | Loan Amount |
|---|---|---|---|
| Open | Gossett Deanna C | $189,375 |
Property History
| Date | Event | Price | Change | Sq Ft Price |
|---|---|---|---|---|
| 11/29/2024 11/29/24 | Off Market | $2,400 | -- | -- |
| 10/26/2024 10/26/24 | For Rent | $2,400 | -- | -- |
Tax History Compared to Growth
Tax History
| Year | Tax Paid | Tax Assessment Tax Assessment Total Assessment is a certain percentage of the fair market value that is determined by local assessors to be the total taxable value of land and additions on the property. | Land | Improvement |
|---|---|---|---|---|
| 2024 | $4,720 | $42,080 | $6,140 | $35,940 |
| 2023 | $5,191 | $45,730 | $5,120 | $40,610 |
| 2022 | $5,191 | $43,700 | $5,120 | $38,580 |
| 2021 | $5,600 | $45,730 | $5,120 | $40,610 |
| 2020 | $5,655 | $45,730 | $5,120 | $40,610 |
| 2019 | $5,138 | $37,440 | $5,120 | $32,320 |
| 2018 | $5,240 | $37,440 | $5,120 | $32,320 |
| 2017 | $3,018 | $24,000 | $5,120 | $18,880 |
| 2016 | $3,113 | $24,000 | $5,120 | $18,880 |
| 2015 | $3,568 | $24,000 | $1,640 | $22,360 |
| 2014 | -- | $24,000 | $1,640 | $22,360 |
| 2013 | -- | $24,000 | $1,640 | $22,360 |