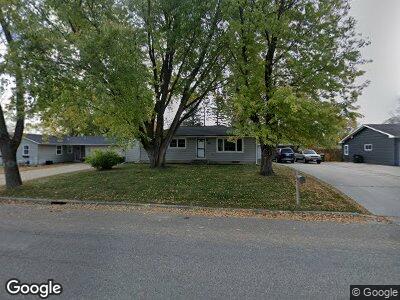
717 Richland Ave SW Willmar, MN 56201
Portland Acres NeighborhoodEstimated Value: $194,804 - $207,000
--
Bed
--
Bath
1,144
Sq Ft
$177/Sq Ft
Est. Value
About This Home
This home is located at 717 Richland Ave SW, Willmar, MN 56201 and is currently estimated at $202,201, approximately $176 per square foot. 717 Richland Ave SW is a home located in Kandiyohi County with nearby schools including Roosevelt Elementary School, Willmar Middle School, and Willmar Senior High School.
Create a Home Valuation Report for This Property
The Home Valuation Report is an in-depth analysis detailing your home's value as well as a comparison with similar homes in the area
Home Values in the Area
Average Home Value in this Area
Tax History Compared to Growth
Tax History
| Year | Tax Paid | Tax Assessment Tax Assessment Total Assessment is a certain percentage of the fair market value that is determined by local assessors to be the total taxable value of land and additions on the property. | Land | Improvement |
|---|---|---|---|---|
| 2024 | $2,132 | $178,200 | $22,400 | $155,800 |
| 2023 | $1,710 | $163,000 | $22,400 | $140,600 |
| 2022 | $1,544 | $144,800 | $20,000 | $124,800 |
| 2021 | $1,328 | $130,700 | $20,000 | $110,700 |
| 2020 | $1,306 | $117,200 | $20,000 | $97,200 |
| 2019 | $1,234 | $115,600 | $20,000 | $95,600 |
| 2018 | $1,206 | $110,600 | $18,400 | $92,200 |
| 2017 | $1,226 | $110,100 | $18,400 | $91,700 |
| 2016 | $1,162 | $821 | $0 | $0 |
| 2015 | -- | $0 | $0 | $0 |
| 2014 | -- | $0 | $0 | $0 |
Source: Public Records
Map
Nearby Homes
- 2509 6th St SW
- 2402 Kenwood Dr SW
- 709 27th Ave SW
- 1609 8th St SW
- 1613 9th St SW
- 1600 6th St SW
- 900 13th Ave SW
- 1031 Willmar Ave SW
- 1613 Richland Ave SW
- 1005 4th St SW
- 1216 15th St SW
- 950 Rice Ave SW
- 1705 15th Ave SW
- 1305 9th St SE
- 712 10th St SW
- 1100 16th St SW
- 1304 10th St SE
- Lot 5 Abbott Dr
- Lot 4 Abbott Dr
- 723 3rd St SW