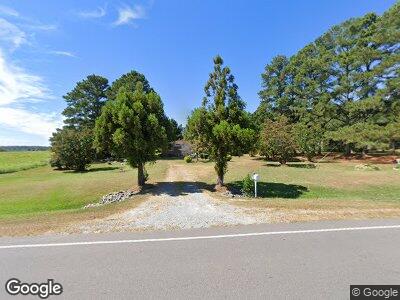
7181 Nc 50 Hwy N Angier, NC 27501
Elevation NeighborhoodEstimated Value: $218,000 - $308,000
3
Beds
2
Baths
1,384
Sq Ft
$189/Sq Ft
Est. Value
About This Home
This home is located at 7181 Nc 50 Hwy N, Angier, NC 27501 and is currently estimated at $262,119, approximately $189 per square foot. 7181 Nc 50 Hwy N is a home with nearby schools including Four Oaks Elementary School, Four Oaks Middle School, and West Johnston High School.
Create a Home Valuation Report for This Property
The Home Valuation Report is an in-depth analysis detailing your home's value as well as a comparison with similar homes in the area
Home Values in the Area
Average Home Value in this Area
Tax History Compared to Growth
Tax History
| Year | Tax Paid | Tax Assessment Tax Assessment Total Assessment is a certain percentage of the fair market value that is determined by local assessors to be the total taxable value of land and additions on the property. | Land | Improvement |
|---|---|---|---|---|
| 2024 | $310 | $101,240 | $27,520 | $73,720 |
| 2023 | $397 | $101,240 | $27,520 | $73,720 |
| 2022 | $820 | $101,240 | $27,520 | $73,720 |
| 2021 | $820 | $101,240 | $27,520 | $73,720 |
| 2020 | $850 | $101,240 | $27,520 | $73,720 |
| 2019 | $830 | $101,240 | $27,520 | $73,720 |
| 2018 | $715 | $85,150 | $21,730 | $63,420 |
| 2017 | $715 | $85,150 | $21,730 | $63,420 |
| 2016 | $715 | $85,150 | $21,730 | $63,420 |
| 2015 | $570 | $85,150 | $21,730 | $63,420 |
| 2014 | $572 | $85,150 | $21,730 | $63,420 |
Source: Public Records
Map
Nearby Homes
- 298 Hannah Yam Ln
- 733 Federal Rd
- 1006 Stephenson Rd
- 430 Federal Rd
- 159 Shady Oaks Dr
- 6383 Elevation Rd
- 203 Patterdale Place
- 6349 Elevation Rd
- 109 Rolling Oaks Ln
- 69 White Azalea Way Homesite 81
- 33 White Azalea Way Homesite 80
- 176 Golfview Ave
- 266 Golfview Ave
- 283 Golfview Ave
- 245 Golfview Ave
- 207 Golfview Ave
- 196 Golfview Ave
- 219 E American Marigold Dr Unit 45
- 209 E American Marigold Dr Unit 44
- 271 White Azalea Way Homesite 30