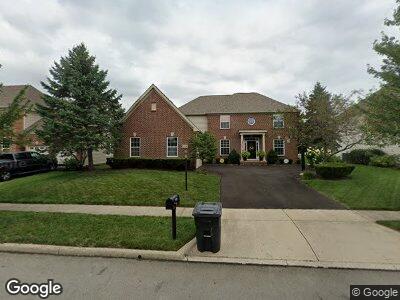
7230 Sumption Dr New Albany, OH 43054
Estimated Value: $755,602 - $869,000
4
Beds
4
Baths
3,364
Sq Ft
$238/Sq Ft
Est. Value
About This Home
This home is located at 7230 Sumption Dr, New Albany, OH 43054 and is currently estimated at $801,401, approximately $238 per square foot. 7230 Sumption Dr is a home located in Franklin County with nearby schools including New Albany Primary School, New Albany Intermediate School, and New Albany Middle School.
Ownership History
Date
Name
Owned For
Owner Type
Purchase Details
Closed on
Apr 21, 2017
Sold by
Howard Russell J and Howard Patricia A
Bought by
Means Christopher Robert and Means Jennifer Renee
Current Estimated Value
Home Financials for this Owner
Home Financials are based on the most recent Mortgage that was taken out on this home.
Original Mortgage
$386,700
Outstanding Balance
$213,553
Interest Rate
4.3%
Mortgage Type
New Conventional
Estimated Equity
$587,848
Purchase Details
Closed on
Mar 15, 2005
Sold by
Romanelli & Hughes Building Co
Bought by
Howard Russell J and Howard Patricia A
Purchase Details
Closed on
Jan 20, 2005
Sold by
New Albany Links Development Co Ltd
Bought by
Romanelli & Hughes Building Co
Create a Home Valuation Report for This Property
The Home Valuation Report is an in-depth analysis detailing your home's value as well as a comparison with similar homes in the area
Home Values in the Area
Average Home Value in this Area
Purchase History
| Date | Buyer | Sale Price | Title Company |
|---|---|---|---|
| Means Christopher Robert | $455,000 | Stewart Title Ag Of Cols Ltd | |
| Howard Russell J | $453,000 | -- | |
| Romanelli & Hughes Building Co | $1,530,000 | -- |
Source: Public Records
Mortgage History
| Date | Status | Borrower | Loan Amount |
|---|---|---|---|
| Open | Means Christopher R | $195,000 | |
| Open | Means Christopher Robert | $386,700 | |
| Previous Owner | Howard Russell J | $273,000 | |
| Previous Owner | Howard Russell J | $296,000 |
Source: Public Records
Tax History Compared to Growth
Tax History
| Year | Tax Paid | Tax Assessment Tax Assessment Total Assessment is a certain percentage of the fair market value that is determined by local assessors to be the total taxable value of land and additions on the property. | Land | Improvement |
|---|---|---|---|---|
| 2024 | $13,540 | $217,630 | $42,000 | $175,630 |
| 2023 | $12,795 | $217,630 | $42,000 | $175,630 |
| 2022 | $12,034 | $155,510 | $29,050 | $126,460 |
| 2021 | $11,582 | $155,510 | $29,050 | $126,460 |
| 2020 | $11,524 | $155,510 | $29,050 | $126,460 |
| 2019 | $10,965 | $134,790 | $25,270 | $109,520 |
| 2018 | $11,337 | $134,790 | $25,270 | $109,520 |
| 2017 | $11,416 | $134,790 | $25,270 | $109,520 |
| 2016 | $11,817 | $133,880 | $41,970 | $91,910 |
| 2015 | $11,840 | $133,880 | $41,970 | $91,910 |
| 2014 | $11,100 | $133,880 | $41,970 | $91,910 |
| 2013 | $5,713 | $127,505 | $39,970 | $87,535 |
Source: Public Records
Map
Nearby Homes
- 6885 Margarum Bend
- 6997 New Albany Links Dr
- 6954 New Albany Rd E
- 7310 Britts Bend W
- 8410 Woodhaven Loop N
- 7565 Steeplechase Ln
- 6828 Bevelhymer Rd
- 10937 Johnstown Rd
- 10087 Johnstown Rd
- 0 E Walnut St Unit 224027455
- 6899 Cedar Brook Glen
- 6869 Central College Rd
- 0 Luna Unit Lot 10 225003340
- 0 Luna Unit Lot 9 225003339
- 0 Moonstone Unit Lot 12 225003342
- 0 Moonstone Unit Lot 11 225003341
- 0 Moonstone Unit Lot 5 225003337
- 0 Moonstone Unit LOT 4 225003335
- 0 Moonstone Unit LOT 3 225003334
- 0 Moonstone Unit LOT 2 225003333