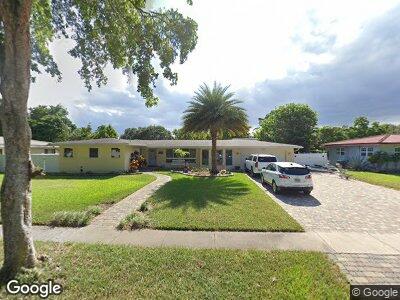
725 Orchid Dr Plantation, FL 33317
Plantation Gardens NeighborhoodEstimated Value: $584,000 - $739,000
3
Beds
2
Baths
1,932
Sq Ft
$332/Sq Ft
Est. Value
About This Home
This home is located at 725 Orchid Dr, Plantation, FL 33317 and is currently estimated at $640,617, approximately $331 per square foot. 725 Orchid Dr is a home located in Broward County with nearby schools including Peters Elementary School, Plantation Middle School, and Plantation High School.
Ownership History
Date
Name
Owned For
Owner Type
Purchase Details
Closed on
May 17, 2013
Sold by
Birtwistle Michelle D and Zitnick Michelle D
Bought by
Zitnick Michelle D and Zitnick Stephen M
Current Estimated Value
Home Financials for this Owner
Home Financials are based on the most recent Mortgage that was taken out on this home.
Original Mortgage
$225,000
Outstanding Balance
$162,933
Interest Rate
3.44%
Mortgage Type
New Conventional
Estimated Equity
$485,756
Purchase Details
Closed on
Oct 15, 2010
Sold by
Countrywide Home Loans Funding Llc
Bought by
Birtwistle Michelle D and Zitnick Stephen M
Home Financials for this Owner
Home Financials are based on the most recent Mortgage that was taken out on this home.
Original Mortgage
$227,436
Interest Rate
4.5%
Mortgage Type
FHA
Purchase Details
Closed on
Jun 8, 2010
Sold by
Skawski Lynn and Skawski Karin B
Bought by
Countrywide Home Loans Funding Llc
Purchase Details
Closed on
Nov 1, 1986
Sold by
Available Not
Bought by
Available Not
Create a Home Valuation Report for This Property
The Home Valuation Report is an in-depth analysis detailing your home's value as well as a comparison with similar homes in the area
Home Values in the Area
Average Home Value in this Area
Purchase History
| Date | Buyer | Sale Price | Title Company |
|---|---|---|---|
| Zitnick Michelle D | -- | Attorney | |
| Birtwistle Michelle D | $230,500 | None Available | |
| Countrywide Home Loans Funding Llc | $156,100 | None Available | |
| Available Not | $66,786 | -- |
Source: Public Records
Mortgage History
| Date | Status | Borrower | Loan Amount |
|---|---|---|---|
| Open | Zitnick Michelle D | $225,000 | |
| Previous Owner | Birtwistle Michelle D | $227,436 |
Source: Public Records
Tax History Compared to Growth
Tax History
| Year | Tax Paid | Tax Assessment Tax Assessment Total Assessment is a certain percentage of the fair market value that is determined by local assessors to be the total taxable value of land and additions on the property. | Land | Improvement |
|---|---|---|---|---|
| 2025 | $3,790 | $233,590 | -- | -- |
| 2024 | $3,700 | $227,120 | -- | -- |
| 2023 | $3,700 | $216,740 | $0 | $0 |
| 2022 | $3,516 | $210,430 | $0 | $0 |
| 2021 | $3,390 | $204,310 | $0 | $0 |
| 2020 | $3,328 | $201,490 | $0 | $0 |
| 2019 | $3,262 | $196,960 | $0 | $0 |
| 2018 | $3,138 | $193,290 | $0 | $0 |
| 2017 | $2,320 | $151,390 | $0 | $0 |
| 2016 | $3,048 | $185,430 | $0 | $0 |
| 2015 | $3,101 | $184,150 | $0 | $0 |
| 2014 | $3,101 | $182,690 | $0 | $0 |
| 2013 | -- | $192,270 | $96,250 | $96,020 |
Source: Public Records
Map
Nearby Homes
- 721 NW 66th Ave
- 861 N Bel Air Dr
- 885 Azalea Ct
- 6800 NW 7th St
- 6851 NW 6th Ct
- 406 NW 68th Ave Unit 304
- 406 NW 68th Ave Unit 116
- 406 NW 68th Ave Unit 215
- 406 NW 68th Ave Unit 319
- 404 NW 68th Ave Unit 513
- 5791 Pine Terrace
- 7001 NW 7th Ct
- 410 NW 68th Ave Unit 207
- 5935 Del Lago Cir Unit 307
- 5935 Del Lago Cir Unit 209
- 5935 Del Lago Cir Unit 208
- 600 Camellia Ct
- 5945 Del Lago Cir Unit 105
- 5945 Del Lago Cir Unit 307
- 5945 Del Lago Cir Unit 201