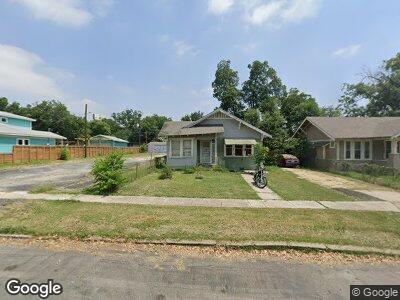
727 Hammond Ave San Antonio, TX 78210
Highland Park NeighborhoodEstimated Value: $173,947 - $242,000
3
Beds
1
Bath
1,079
Sq Ft
$187/Sq Ft
Est. Value
About This Home
This home is located at 727 Hammond Ave, San Antonio, TX 78210 and is currently estimated at $201,237, approximately $186 per square foot. 727 Hammond Ave is a home located in Bexar County with nearby schools including Highland Park Elementary School, Highlands High School, and Jubilee Highland Park.
Ownership History
Date
Name
Owned For
Owner Type
Purchase Details
Closed on
Oct 7, 2024
Sold by
Goldline Investments Llc
Bought by
Mendez Renovations Inc
Current Estimated Value
Home Financials for this Owner
Home Financials are based on the most recent Mortgage that was taken out on this home.
Original Mortgage
$500,000
Outstanding Balance
$499,067
Interest Rate
6.35%
Mortgage Type
New Conventional
Estimated Equity
-$332,265
Purchase Details
Closed on
Oct 4, 2024
Sold by
Garrett Steven Bernard
Bought by
Holden Cecilia and Garrett Connie
Home Financials for this Owner
Home Financials are based on the most recent Mortgage that was taken out on this home.
Original Mortgage
$500,000
Outstanding Balance
$499,067
Interest Rate
6.35%
Mortgage Type
New Conventional
Estimated Equity
-$332,265
Purchase Details
Closed on
Aug 3, 2005
Sold by
Castillo Jennifer Garrett
Bought by
Garrett Raymond M
Purchase Details
Closed on
Mar 9, 1999
Sold by
Garrett Kenneth R
Bought by
Garrett Jennifer
Create a Home Valuation Report for This Property
The Home Valuation Report is an in-depth analysis detailing your home's value as well as a comparison with similar homes in the area
Home Values in the Area
Average Home Value in this Area
Purchase History
| Date | Buyer | Sale Price | Title Company |
|---|---|---|---|
| Mendez Renovations Inc | -- | Spartan Title | |
| Goldline Investments Llc | -- | None Listed On Document | |
| Holden Cecilia | -- | None Listed On Document | |
| Garrett Raymond M | -- | Commerce Title Company | |
| Garrett Jennifer | -- | -- |
Source: Public Records
Mortgage History
| Date | Status | Borrower | Loan Amount |
|---|---|---|---|
| Open | Mendez Renovations Inc | $500,000 |
Source: Public Records
Tax History Compared to Growth
Tax History
| Year | Tax Paid | Tax Assessment Tax Assessment Total Assessment is a certain percentage of the fair market value that is determined by local assessors to be the total taxable value of land and additions on the property. | Land | Improvement |
|---|---|---|---|---|
| 2023 | $430 | $87,374 | $61,300 | $61,450 |
| 2022 | $2,152 | $79,431 | $48,670 | $65,630 |
| 2021 | $2,017 | $72,210 | $29,170 | $55,350 |
| 2020 | $1,861 | $65,645 | $24,290 | $51,600 |
| 2019 | $1,710 | $59,677 | $24,290 | $47,940 |
| 2018 | $1,539 | $54,252 | $14,770 | $40,310 |
| 2017 | $1,392 | $49,320 | $14,770 | $34,550 |
| 2016 | $1,783 | $63,180 | $12,470 | $50,710 |
| 2015 | $1,254 | $59,499 | $12,470 | $49,790 |
| 2014 | $1,254 | $54,090 | $0 | $0 |
Source: Public Records
Map
Nearby Homes
- LOT 34-35 Westfall Ave
- 543 Westfall Ave
- 837 Westfall Ave
- 547 Rigsby Ave
- 540 Rigsby Ave
- 1141 E Highland Blvd
- 114 Elgin Ave
- 603 Hansford St Lots 41 & 42
- 527 Rigsby Ave
- 543 Kayton Ave
- 923 Saint Anthony Ave
- 519 Rigsby Ave
- 519 Kayton Ave
- 725 Westfall Ave
- 743 Avant Ave
- 935 E Highland Blvd
- 1301 E Highland Blvd
- 933 Denver Blvd
- 506 Kayton Ave
- 1426 S New Braunfels Ave