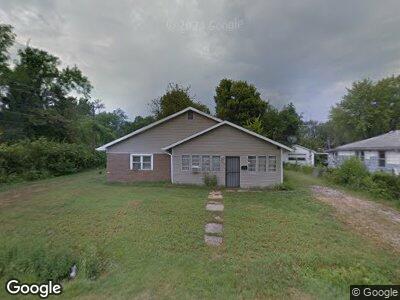
728 Howell Ave East Saint Louis, IL 62206
Cahokia Heights NeighborhoodEstimated Value: $36,459 - $98,000
4
Beds
1
Bath
1,640
Sq Ft
$48/Sq Ft
Est. Value
About This Home
This home is located at 728 Howell Ave, East Saint Louis, IL 62206 and is currently estimated at $78,115, approximately $47 per square foot. 728 Howell Ave is a home located in St. Clair County.
Ownership History
Date
Name
Owned For
Owner Type
Purchase Details
Closed on
Jul 26, 2017
Sold by
County Of St Clair
Bought by
Cust Etc and M Foerster #Z086803
Current Estimated Value
Purchase Details
Closed on
Feb 11, 2011
Sold by
Regions Bank
Bought by
Johnson Walter
Purchase Details
Closed on
Oct 28, 2010
Sold by
Jmr Enterprises Inc
Bought by
Regions Bank
Purchase Details
Closed on
Nov 9, 2006
Sold by
Sintzel Investments Inc
Bought by
Jmr Enterprises Inc
Home Financials for this Owner
Home Financials are based on the most recent Mortgage that was taken out on this home.
Original Mortgage
$59,650
Interest Rate
7.6%
Mortgage Type
Unknown
Purchase Details
Closed on
Aug 4, 2006
Sold by
Williamson Daren
Bought by
Sintzel Investments Inc
Home Financials for this Owner
Home Financials are based on the most recent Mortgage that was taken out on this home.
Original Mortgage
$40,001
Interest Rate
6.7%
Mortgage Type
Unknown
Purchase Details
Closed on
May 27, 2004
Sold by
Fritz Tina
Bought by
Williamson Daren
Purchase Details
Closed on
Jul 27, 2001
Sold by
Wheeler Johnny
Bought by
Fritz Tina
Create a Home Valuation Report for This Property
The Home Valuation Report is an in-depth analysis detailing your home's value as well as a comparison with similar homes in the area
Home Values in the Area
Average Home Value in this Area
Purchase History
| Date | Buyer | Sale Price | Title Company |
|---|---|---|---|
| Cust Etc | -- | Attorney | |
| Johnson Walter | $7,500 | None Available | |
| Regions Bank | -- | None Available | |
| Jmr Enterprises Inc | -- | Ticor Title Insurance Co | |
| Sintzel Investments Inc | $12,000 | Agape Title | |
| Williamson Daren | -- | -- | |
| Fritz Tina | $1,000 | -- |
Source: Public Records
Mortgage History
| Date | Status | Borrower | Loan Amount |
|---|---|---|---|
| Previous Owner | Jmr Enterprises | $59,650 | |
| Previous Owner | Sintzel Investments Inc | $40,001 |
Source: Public Records
Tax History Compared to Growth
Tax History
| Year | Tax Paid | Tax Assessment Tax Assessment Total Assessment is a certain percentage of the fair market value that is determined by local assessors to be the total taxable value of land and additions on the property. | Land | Improvement |
|---|---|---|---|---|
| 2023 | $2,215 | $11,655 | $1,602 | $10,053 |
| 2022 | $2,027 | $10,215 | $1,404 | $8,811 |
| 2021 | $2,078 | $9,679 | $1,330 | $8,349 |
| 2020 | $2,677 | $11,489 | $1,394 | $10,095 |
| 2019 | $2,681 | $11,489 | $1,394 | $10,095 |
| 2018 | $2,668 | $11,656 | $1,414 | $10,242 |
| 2017 | $2,520 | $11,375 | $1,380 | $9,995 |
| 2016 | $2,781 | $11,333 | $1,375 | $9,958 |
| 2014 | $1,065 | $11,210 | $1,360 | $9,850 |
| 2013 | $2,400 | $10,515 | $1,276 | $9,239 |
Source: Public Records
Map
Nearby Homes
- 801 Howell Ave
- 811 Sparks Ave
- 821 Howell Ave
- 845 Mildred Ave
- 752 Leon St
- 1100 Richard Dr
- 1132 St Stephen’s
- 1129 Saint Michael Dr
- 1135 Saint Stephens Dr
- 1152 Camp Jackson Rd
- 1203 Julie Ave
- 1209 Williams St
- 1156 Jones St
- 1211 Saint Michael Dr
- 445 Jerome Ln
- 603 Saint Nicholas Dr
- 1304 Julie Ave
- 1150 Smith St
- 818 Saint Thomas Ln
- 1118 Saint Benedict Dr