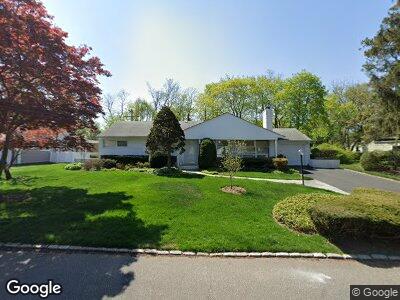
73 High Hollow Rd Roslyn Heights, NY 11577
East Hills NeighborhoodEstimated Value: $1,086,876 - $1,388,000
--
Bed
2
Baths
1,900
Sq Ft
$651/Sq Ft
Est. Value
About This Home
This home is located at 73 High Hollow Rd, Roslyn Heights, NY 11577 and is currently estimated at $1,237,438, approximately $651 per square foot. 73 High Hollow Rd is a home located in Nassau County with nearby schools including Roslyn Middle School, Roslyn High School, and Holy Child Academy.
Ownership History
Date
Name
Owned For
Owner Type
Purchase Details
Closed on
Jan 26, 2023
Sold by
Weinberg Greta
Bought by
Weinberg Greta and Weinberg Lisa
Current Estimated Value
Create a Home Valuation Report for This Property
The Home Valuation Report is an in-depth analysis detailing your home's value as well as a comparison with similar homes in the area
Home Values in the Area
Average Home Value in this Area
Purchase History
| Date | Buyer | Sale Price | Title Company |
|---|---|---|---|
| Weinberg Greta | -- | Judicial Title |
Source: Public Records
Tax History Compared to Growth
Tax History
| Year | Tax Paid | Tax Assessment Tax Assessment Total Assessment is a certain percentage of the fair market value that is determined by local assessors to be the total taxable value of land and additions on the property. | Land | Improvement |
|---|---|---|---|---|
| 2024 | $2,927 | $795 | $355 | $440 |
| 2023 | $14,829 | $823 | $367 | $456 |
| 2022 | $13,442 | $795 | $355 | $440 |
| 2021 | $14,995 | $858 | $383 | $475 |
| 2020 | $14,995 | $1,204 | $1,050 | $154 |
| 2019 | $14,737 | $1,204 | $1,050 | $154 |
| 2018 | $13,958 | $1,204 | $0 | $0 |
| 2017 | $10,440 | $1,204 | $1,050 | $154 |
| 2016 | $12,973 | $1,204 | $998 | $206 |
| 2015 | $2,382 | $1,204 | $998 | $206 |
| 2014 | $2,382 | $1,204 | $998 | $206 |
| 2013 | $2,394 | $1,267 | $1,050 | $217 |
Source: Public Records