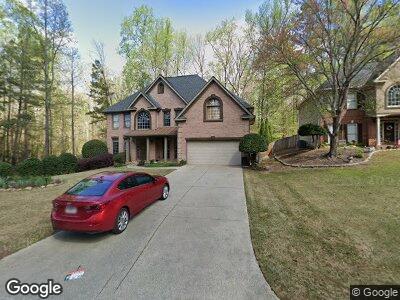
730 Springbrook Ct Alpharetta, GA 30004
Estimated Value: $716,000 - $750,000
5
Beds
3
Baths
2,869
Sq Ft
$254/Sq Ft
Est. Value
About This Home
This home is located at 730 Springbrook Ct, Alpharetta, GA 30004 and is currently estimated at $728,235, approximately $253 per square foot. 730 Springbrook Ct is a home located in Fulton County with nearby schools including Cogburn Woods Elementary School, Hopewell Middle School, and Cambridge High School.
Ownership History
Date
Name
Owned For
Owner Type
Purchase Details
Closed on
Jan 24, 2003
Sold by
Mckenzie Mario E and Mckenzie Kristen G
Bought by
Mani Spidhar
Current Estimated Value
Home Financials for this Owner
Home Financials are based on the most recent Mortgage that was taken out on this home.
Original Mortgage
$208,000
Interest Rate
5.98%
Mortgage Type
New Conventional
Purchase Details
Closed on
May 10, 1999
Sold by
Mckenzie Mario E
Bought by
Mckenzie Mario E and Mckenzie Kristen G
Home Financials for this Owner
Home Financials are based on the most recent Mortgage that was taken out on this home.
Original Mortgage
$223,150
Interest Rate
6.87%
Mortgage Type
New Conventional
Purchase Details
Closed on
May 1, 1999
Sold by
Morrison Homes / Fl Inc
Bought by
Mckenzie Mario E
Home Financials for this Owner
Home Financials are based on the most recent Mortgage that was taken out on this home.
Original Mortgage
$223,150
Interest Rate
6.87%
Mortgage Type
New Conventional
Create a Home Valuation Report for This Property
The Home Valuation Report is an in-depth analysis detailing your home's value as well as a comparison with similar homes in the area
Home Values in the Area
Average Home Value in this Area
Purchase History
| Date | Buyer | Sale Price | Title Company |
|---|---|---|---|
| Mani Spidhar | $260,000 | -- | |
| Mckenzie Mario E | -- | -- | |
| Mckenzie Mario E | $234,900 | -- |
Source: Public Records
Mortgage History
| Date | Status | Borrower | Loan Amount |
|---|---|---|---|
| Open | Manickam Sridhar | $150,000 | |
| Closed | Manickam Sridhar | $219,000 | |
| Closed | Manickam Sridhar | $183,000 | |
| Closed | Manickam Sridhar | $23,000 | |
| Closed | Mani Spidhar | $208,000 | |
| Previous Owner | Mckenzie Mario E | $223,150 |
Source: Public Records
Tax History Compared to Growth
Tax History
| Year | Tax Paid | Tax Assessment Tax Assessment Total Assessment is a certain percentage of the fair market value that is determined by local assessors to be the total taxable value of land and additions on the property. | Land | Improvement |
|---|---|---|---|---|
| 2023 | $5,467 | $193,680 | $49,360 | $144,320 |
| 2022 | $3,319 | $193,680 | $49,360 | $144,320 |
| 2021 | $3,309 | $188,040 | $47,920 | $140,120 |
| 2020 | $3,340 | $185,760 | $47,320 | $138,440 |
| 2019 | $643 | $182,520 | $46,520 | $136,000 |
| 2018 | $4,176 | $178,200 | $45,400 | $132,800 |
| 2017 | $3,378 | $129,040 | $28,480 | $100,560 |
| 2016 | $3,244 | $123,160 | $28,480 | $94,680 |
| 2015 | $3,768 | $123,160 | $28,480 | $94,680 |
| 2014 | $3,368 | $123,160 | $28,480 | $94,680 |
Source: Public Records
Map
Nearby Homes
- 2080 N Bethany Creek Dr
- 1225 S Bethany Creek Dr
- 315 Aurelia Trace
- 3395 Deer Valley Dr
- 3692 Archgate Ct
- 3380 Galleon Dr
- 1070 Krobot Way
- 14143 Yacht Terrace
- 3329 Seaward View
- 1145 Ledmark Ct
- 3305 Regatta Grove Unit 902
- 3305 Regatta Grove
- 3307 Regatta Grove
- 925 Hargrove Point Way
- 310 Silhouette Ct
- 3308 Regatta Grove
- 13400 Avensong Crossing
- 3390 Sonata Ln
- 14187 Yacht Terrace