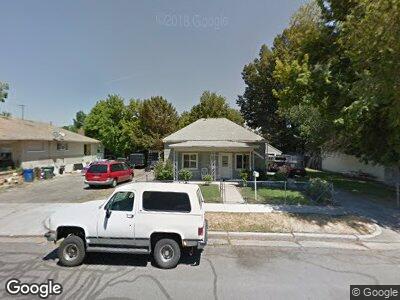
731 S Jeremy St Unit 6 Salt Lake City, UT 84104
Poplar Grove NeighborhoodEstimated Value: $336,000 - $396,000
2
Beds
1
Bath
1,176
Sq Ft
$316/Sq Ft
Est. Value
About This Home
This home is located at 731 S Jeremy St Unit 6, Salt Lake City, UT 84104 and is currently estimated at $371,960, approximately $316 per square foot. 731 S Jeremy St Unit 6 is a home located in Salt Lake County with nearby schools including Riley Elementary School, Glendale Middle, and Highland High School.
Ownership History
Date
Name
Owned For
Owner Type
Purchase Details
Closed on
Aug 1, 2016
Sold by
Martinez Andres C and Martinez Teresa
Bought by
Okamura Joseph
Current Estimated Value
Home Financials for this Owner
Home Financials are based on the most recent Mortgage that was taken out on this home.
Original Mortgage
$137,464
Outstanding Balance
$111,360
Interest Rate
3.54%
Mortgage Type
New Conventional
Estimated Equity
$260,600
Purchase Details
Closed on
Aug 28, 1997
Sold by
Powell Robert A and Powell Helen
Bought by
Martinez Andres C and Martinez Teresa
Home Financials for this Owner
Home Financials are based on the most recent Mortgage that was taken out on this home.
Original Mortgage
$87,372
Interest Rate
7.43%
Mortgage Type
FHA
Purchase Details
Closed on
Apr 18, 1995
Sold by
Mountain High Investors Lp No 2
Bought by
Powell Robert A and Powell Helen
Purchase Details
Closed on
Aug 31, 1994
Sold by
Mountain High Investors L P
Bought by
Powell Robert A and Powell Helen
Create a Home Valuation Report for This Property
The Home Valuation Report is an in-depth analysis detailing your home's value as well as a comparison with similar homes in the area
Home Values in the Area
Average Home Value in this Area
Purchase History
| Date | Buyer | Sale Price | Title Company |
|---|---|---|---|
| Okamura Joseph | -- | First American Title | |
| Martinez Andres C | -- | -- | |
| Powell Robert A | -- | First American Title | |
| Powell Robert A | -- | -- |
Source: Public Records
Mortgage History
| Date | Status | Borrower | Loan Amount |
|---|---|---|---|
| Open | Okamura Joseph | $137,464 | |
| Previous Owner | Martinez Andres | $19,784 | |
| Previous Owner | Martinez Andres C | $5,000 | |
| Previous Owner | Martinez Andres C | $87,372 |
Source: Public Records
Tax History Compared to Growth
Tax History
| Year | Tax Paid | Tax Assessment Tax Assessment Total Assessment is a certain percentage of the fair market value that is determined by local assessors to be the total taxable value of land and additions on the property. | Land | Improvement |
|---|---|---|---|---|
| 2023 | $1,139 | $209,400 | $105,100 | $104,300 |
| 2022 | $1,250 | $215,700 | $103,000 | $112,700 |
| 2021 | $1,027 | $160,400 | $78,000 | $82,400 |
| 2020 | $1,013 | $150,600 | $69,700 | $80,900 |
| 2019 | $1,034 | $144,700 | $69,700 | $75,000 |
| 2018 | $827 | $112,700 | $63,000 | $49,700 |
| 2017 | $900 | $114,900 | $63,000 | $51,900 |
| 2016 | $876 | $106,200 | $53,000 | $53,200 |
| 2015 | $653 | $75,000 | $53,600 | $21,400 |
| 2014 | $588 | $67,000 | $51,300 | $15,700 |
Source: Public Records
Map
Nearby Homes