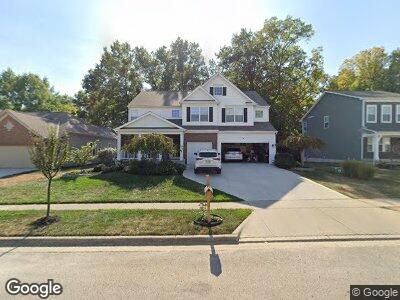
7313 Bromfield Dr Canal Winchester, OH 43110
Estimated Value: $459,160 - $599,000
4
Beds
3
Baths
2,805
Sq Ft
$181/Sq Ft
Est. Value
About This Home
This home is located at 7313 Bromfield Dr, Canal Winchester, OH 43110 and is currently estimated at $506,540, approximately $180 per square foot. 7313 Bromfield Dr is a home located in Franklin County with nearby schools including Winchester Trail Elementary School, Indian Trail Elementary School, and Canal Winchester Middle School.
Ownership History
Date
Name
Owned For
Owner Type
Purchase Details
Closed on
May 19, 2021
Sold by
Vance Robert G
Bought by
Pesta Jonathan and Pesta Angela N
Current Estimated Value
Home Financials for this Owner
Home Financials are based on the most recent Mortgage that was taken out on this home.
Original Mortgage
$427,500
Outstanding Balance
$391,238
Interest Rate
2.9%
Mortgage Type
New Conventional
Estimated Equity
$105,860
Purchase Details
Closed on
Jul 12, 2019
Sold by
Vance Rosemary E
Bought by
Vance Robert G
Purchase Details
Closed on
Mar 23, 2007
Sold by
M/I Homes Of Central Ohio Llc
Bought by
Vance Robert V and Vance Rosemary E
Home Financials for this Owner
Home Financials are based on the most recent Mortgage that was taken out on this home.
Original Mortgage
$233,040
Interest Rate
6.25%
Mortgage Type
Purchase Money Mortgage
Create a Home Valuation Report for This Property
The Home Valuation Report is an in-depth analysis detailing your home's value as well as a comparison with similar homes in the area
Home Values in the Area
Average Home Value in this Area
Purchase History
| Date | Buyer | Sale Price | Title Company |
|---|---|---|---|
| Pesta Jonathan | $450,000 | Amerititle Downtown Columbus | |
| Vance Robert G | -- | None Available | |
| Vance Robert V | $303,400 | Transohio R |
Source: Public Records
Mortgage History
| Date | Status | Borrower | Loan Amount |
|---|---|---|---|
| Open | Pesta Jonathan | $427,500 | |
| Open | Vance Robert G | $2,000,000 | |
| Closed | Vance Robert G | $224,783 | |
| Closed | Vance Robert G | $225,700 | |
| Previous Owner | Vance Robert V | $233,040 |
Source: Public Records
Tax History Compared to Growth
Tax History
| Year | Tax Paid | Tax Assessment Tax Assessment Total Assessment is a certain percentage of the fair market value that is determined by local assessors to be the total taxable value of land and additions on the property. | Land | Improvement |
|---|---|---|---|---|
| 2024 | $8,095 | $145,220 | $36,230 | $108,990 |
| 2023 | $8,049 | $145,215 | $36,225 | $108,990 |
| 2022 | $9,588 | $145,880 | $15,120 | $130,760 |
| 2021 | $9,108 | $145,880 | $15,120 | $130,760 |
| 2020 | $9,087 | $145,880 | $15,120 | $130,760 |
| 2019 | $8,809 | $122,260 | $12,600 | $109,660 |
| 2018 | $8,088 | $122,260 | $12,600 | $109,660 |
| 2017 | $8,648 | $122,260 | $12,600 | $109,660 |
| 2016 | $7,527 | $100,210 | $14,070 | $86,140 |
| 2015 | $7,547 | $100,210 | $14,070 | $86,140 |
| 2014 | $7,064 | $100,210 | $14,070 | $86,140 |
| 2013 | $3,691 | $105,455 | $14,805 | $90,650 |
Source: Public Records
Map
Nearby Homes
- 7265 Bromfield Dr
- 7350 Bromfield Dr
- 6847 Falcon Dr Unit 48
- 7191 Rosemount Way
- 7293 Crossett Ct
- 7317 Ct
- 7334 Crossett Ct
- 6565 Hemmingford Dr
- 260 Old Coach Place
- 6324 Rossmore Ln
- 7481 Creek Ct
- 6719 Braeswick Ct
- 6599 Cherry Bend
- 6759 John Dr
- 7514 Murdock Ln
- 6741 Bigerton Bend
- 6735 Bigerton Bend
- 8256 Alban Woods Way NW
- 7245 Konold Ct
- 0 W Waterloo St Unit 223040245