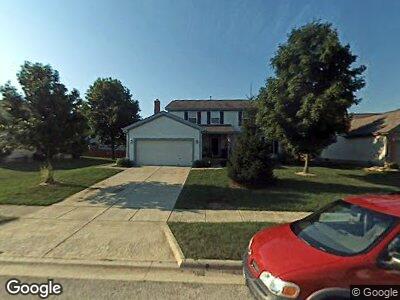
7328 Old Creek Ln Canal Winchester, OH 43110
Estimated Value: $357,000 - $405,000
4
Beds
3
Baths
2,124
Sq Ft
$177/Sq Ft
Est. Value
About This Home
This home is located at 7328 Old Creek Ln, Canal Winchester, OH 43110 and is currently estimated at $376,019, approximately $177 per square foot. 7328 Old Creek Ln is a home located in Franklin County with nearby schools including Winchester Trail Elementary School, Indian Trail Elementary School, and Canal Winchester Middle School.
Ownership History
Date
Name
Owned For
Owner Type
Purchase Details
Closed on
Jul 24, 2021
Sold by
Lynde Dean A and Lynde Jodi L
Bought by
Lynde Kevin M and Smith Shannon R
Current Estimated Value
Home Financials for this Owner
Home Financials are based on the most recent Mortgage that was taken out on this home.
Original Mortgage
$187,000
Outstanding Balance
$171,865
Interest Rate
2.9%
Mortgage Type
New Conventional
Estimated Equity
$204,154
Purchase Details
Closed on
Jun 20, 1997
Sold by
Sue Parker James Edward and Sue Linda
Bought by
Lynde Dean A and Lynde Jodi L
Home Financials for this Owner
Home Financials are based on the most recent Mortgage that was taken out on this home.
Original Mortgage
$130,000
Interest Rate
8.01%
Mortgage Type
Balloon
Purchase Details
Closed on
Nov 17, 1995
Sold by
Robinson Ted J
Bought by
Parker James E and Parker Linda S
Purchase Details
Closed on
Dec 1, 1994
Sold by
M/I Schottenstein Homes
Bought by
Robinson Ted J and Robinson Nancy A
Home Financials for this Owner
Home Financials are based on the most recent Mortgage that was taken out on this home.
Original Mortgage
$122,200
Interest Rate
8.91%
Mortgage Type
New Conventional
Create a Home Valuation Report for This Property
The Home Valuation Report is an in-depth analysis detailing your home's value as well as a comparison with similar homes in the area
Home Values in the Area
Average Home Value in this Area
Purchase History
| Date | Buyer | Sale Price | Title Company |
|---|---|---|---|
| Lynde Kevin M | $250,000 | Hbi Title Services Inc | |
| Lynde Dean A | $162,500 | Foundation Title Agency Inc | |
| Parker James E | $152,900 | -- | |
| Robinson Ted J | $152,755 | -- |
Source: Public Records
Mortgage History
| Date | Status | Borrower | Loan Amount |
|---|---|---|---|
| Open | Lynde Kevin M | $187,000 | |
| Previous Owner | Lynde Jodi L | $60,000 | |
| Previous Owner | Lynde Jodi | $121,000 | |
| Previous Owner | Lynde Dean A | $149,600 | |
| Previous Owner | Lynde Dean A | $130,000 | |
| Previous Owner | Robinson Ted J | $122,200 |
Source: Public Records
Tax History Compared to Growth
Tax History
| Year | Tax Paid | Tax Assessment Tax Assessment Total Assessment is a certain percentage of the fair market value that is determined by local assessors to be the total taxable value of land and additions on the property. | Land | Improvement |
|---|---|---|---|---|
| 2024 | $6,033 | $108,220 | $34,510 | $73,710 |
| 2023 | $5,998 | $108,220 | $34,510 | $73,710 |
| 2022 | $5,250 | $79,870 | $10,360 | $69,510 |
| 2021 | $5,305 | $79,870 | $10,360 | $69,510 |
| 2020 | $5,293 | $79,870 | $10,360 | $69,510 |
| 2019 | $5,256 | $67,730 | $8,650 | $59,080 |
| 2018 | $4,848 | $67,730 | $8,650 | $59,080 |
| 2017 | $5,160 | $67,730 | $8,650 | $59,080 |
| 2016 | $4,534 | $55,100 | $8,930 | $46,170 |
| 2015 | $4,547 | $55,100 | $8,930 | $46,170 |
| 2014 | $4,255 | $55,100 | $8,930 | $46,170 |
| 2013 | $2,212 | $57,960 | $9,380 | $48,580 |
Source: Public Records
Map
Nearby Homes
- 7245 Konold Ct
- 7191 Rosemount Way
- 6324 Rossmore Ln
- 7317 Ct
- 7334 Crossett Ct
- 7265 Bromfield Dr
- 7293 Crossett Ct
- 7536 Lithopolis Rd
- 6847 Falcon Dr Unit 48
- 6565 Hemmingford Dr
- 7350 Bromfield Dr
- 7481 Creek Ct
- 6719 Braeswick Ct
- 6390 Streams End Dr
- 7514 Murdock Ln
- 7866 Mountain Ash Ln
- 260 Old Coach Place
- 6759 John Dr
- 6599 Cherry Bend
- 6741 Bigerton Bend