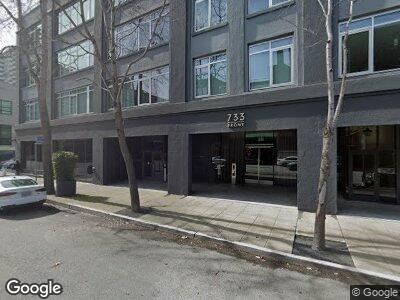
733 Front 733 Front St Unit 411 San Francisco, CA 94111
Financial District/Barbary Coast NeighborhoodEstimated Value: $835,000 - $954,000
1
Bed
1
Bath
885
Sq Ft
$996/Sq Ft
Est. Value
About This Home
This home is located at 733 Front St Unit 411, San Francisco, CA 94111 and is currently estimated at $881,587, approximately $996 per square foot. 733 Front St Unit 411 is a home located in San Francisco County with nearby schools including Chin (John Yehall) Elementary School, Francisco Middle School, and Sterne School.
Ownership History
Date
Name
Owned For
Owner Type
Purchase Details
Closed on
Jan 11, 2017
Sold by
Liew Chien
Bought by
Liew Chien and Liew Hwira
Current Estimated Value
Home Financials for this Owner
Home Financials are based on the most recent Mortgage that was taken out on this home.
Original Mortgage
$485,000
Outstanding Balance
$251,282
Interest Rate
3.36%
Mortgage Type
New Conventional
Estimated Equity
$668,316
Purchase Details
Closed on
Mar 1, 2016
Sold by
Liew Chien and Liew Chien Loong
Bought by
Liew Chien
Purchase Details
Closed on
Aug 16, 2007
Sold by
Liew Hwira
Bought by
Liew Chien Loong
Home Financials for this Owner
Home Financials are based on the most recent Mortgage that was taken out on this home.
Original Mortgage
$596,000
Interest Rate
6%
Mortgage Type
Purchase Money Mortgage
Purchase Details
Closed on
Jul 9, 2007
Sold by
Front Street Lp
Bought by
Liew Chien Loong
Home Financials for this Owner
Home Financials are based on the most recent Mortgage that was taken out on this home.
Original Mortgage
$596,000
Interest Rate
6%
Mortgage Type
Purchase Money Mortgage
Create a Home Valuation Report for This Property
The Home Valuation Report is an in-depth analysis detailing your home's value as well as a comparison with similar homes in the area
Home Values in the Area
Average Home Value in this Area
Purchase History
| Date | Buyer | Sale Price | Title Company |
|---|---|---|---|
| Liew Chien | -- | Chicago Title Company | |
| Liew Chien | -- | None Available | |
| Liew Chien Loong | -- | Chicago Title Co | |
| Liew Chien Loong | $745,000 | Chicago Title Co |
Source: Public Records
Mortgage History
| Date | Status | Borrower | Loan Amount |
|---|---|---|---|
| Open | Liew Chien | $485,000 | |
| Closed | Liew Chien Loong | $596,000 | |
| Previous Owner | Liew Chien Loong | $596,000 |
Source: Public Records
Tax History Compared to Growth
Tax History
| Year | Tax Paid | Tax Assessment Tax Assessment Total Assessment is a certain percentage of the fair market value that is determined by local assessors to be the total taxable value of land and additions on the property. | Land | Improvement |
|---|---|---|---|---|
| 2024 | $12,049 | $959,368 | $575,622 | $383,746 |
| 2023 | $11,855 | $940,558 | $564,336 | $376,222 |
| 2022 | $11,621 | $922,117 | $553,271 | $368,846 |
| 2021 | $11,414 | $904,037 | $542,423 | $361,614 |
| 2020 | $11,524 | $894,769 | $536,862 | $357,907 |
| 2019 | $11,083 | $877,226 | $526,336 | $350,890 |
| 2018 | $10,711 | $860,026 | $516,016 | $344,010 |
| 2017 | $10,287 | $843,164 | $505,899 | $337,265 |
| 2016 | $10,110 | $826,632 | $495,980 | $330,652 |
| 2015 | $9,984 | $814,216 | $488,530 | $325,686 |
| 2014 | -- | $798,268 | $478,961 | $319,307 |
Source: Public Records
About 733 Front
Map
Nearby Homes
- 288 Pacific Ave Unit 4E
- 288 Pacific Ave Unit 3A
- 170 Pacific Ave Unit 45
- 350 Jackson St Unit 303
- 640 Davis St Unit 1
- 1111 Sansome St
- 400 Broadway
- 1113 Montgomery St
- 1146 Montgomery St
- 455 Vallejo St Unit 105
- 531 Jackson St
- 646-654 Washington St
- 54 Castle St
- 221 Filbert St
- 31 Romolo Place Unit 2
- 31 Romolo Place Unit 6
- 1340 Kearny St
- 101 Telegraph Hill Blvd Unit A
- 201 Sansome St Unit 1105
- 754 Pacific Ave