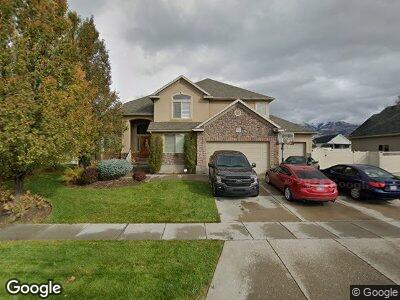
733 S 600 W Layton, UT 84041
Estimated Value: $741,000 - $854,000
5
Beds
3
Baths
4,223
Sq Ft
$185/Sq Ft
Est. Value
About This Home
This home is located at 733 S 600 W, Layton, UT 84041 and is currently estimated at $781,384, approximately $185 per square foot. 733 S 600 W is a home located in Davis County with nearby schools including Layton Elementary School, Fairfield Junior High School, and Davis High School.
Ownership History
Date
Name
Owned For
Owner Type
Purchase Details
Closed on
Apr 21, 2009
Sold by
Rigby Heather L and Rigby Stanley C
Bought by
Moss and Moss Michelle
Current Estimated Value
Home Financials for this Owner
Home Financials are based on the most recent Mortgage that was taken out on this home.
Original Mortgage
$279,200
Interest Rate
4.8%
Mortgage Type
Purchase Money Mortgage
Purchase Details
Closed on
Jun 11, 2008
Sold by
Perry Development Llc
Bought by
Perry Homes Utah Inc
Home Financials for this Owner
Home Financials are based on the most recent Mortgage that was taken out on this home.
Original Mortgage
$294,900
Interest Rate
6.05%
Mortgage Type
Purchase Money Mortgage
Purchase Details
Closed on
Jun 9, 2008
Sold by
Perry Homes Utah Inc
Bought by
Rigby Heather L and Rigby Stanley C
Home Financials for this Owner
Home Financials are based on the most recent Mortgage that was taken out on this home.
Original Mortgage
$294,900
Interest Rate
6.05%
Mortgage Type
Purchase Money Mortgage
Purchase Details
Closed on
Jul 9, 2006
Sold by
Perry Development Llc
Bought by
Perry Homes Utah Inc
Create a Home Valuation Report for This Property
The Home Valuation Report is an in-depth analysis detailing your home's value as well as a comparison with similar homes in the area
Home Values in the Area
Average Home Value in this Area
Purchase History
| Date | Buyer | Sale Price | Title Company |
|---|---|---|---|
| Moss | -- | First American Title | |
| Perry Homes Utah Inc | -- | Pinnacle Title Ins Agency | |
| Rigby Heather L | -- | Pinnacle Title Ins Agency | |
| Perry Homes Utah Inc | -- | Meridian Title Company |
Source: Public Records
Mortgage History
| Date | Status | Borrower | Loan Amount |
|---|---|---|---|
| Open | Moss | $271,000 | |
| Closed | Moss | $270,800 | |
| Closed | Moss | $279,200 | |
| Previous Owner | Rigby Heather L | $294,900 |
Source: Public Records
Tax History Compared to Growth
Tax History
| Year | Tax Paid | Tax Assessment Tax Assessment Total Assessment is a certain percentage of the fair market value that is determined by local assessors to be the total taxable value of land and additions on the property. | Land | Improvement |
|---|---|---|---|---|
| 2024 | $3,662 | $387,200 | $132,167 | $255,033 |
| 2023 | $3,584 | $668,000 | $135,408 | $532,592 |
| 2022 | $3,793 | $383,900 | $81,564 | $302,336 |
| 2021 | $3,637 | $549,000 | $122,349 | $426,651 |
| 2020 | $3,294 | $477,000 | $103,755 | $373,245 |
| 2019 | $3,159 | $448,000 | $104,513 | $343,487 |
| 2018 | $2,900 | $413,000 | $91,880 | $321,120 |
| 2016 | $2,830 | $207,900 | $37,090 | $170,810 |
| 2015 | $2,689 | $187,495 | $37,090 | $150,405 |
| 2014 | $2,569 | $183,144 | $37,090 | $146,054 |
| 2013 | -- | $181,487 | $37,058 | $144,429 |
Source: Public Records
Map
Nearby Homes
- 681 S Vance Dr
- 765 W Farming Way
- 865 W 700 S
- 1832 W Robins Way
- 1910 W Walker Farm Dr
- 1041 S Hill Farms Dr
- 1040 Hill Farms Dr
- 49 E 850 S
- 618 W 225 S
- 1014 W 350 S
- 1094 W 400 S
- 417 N Hill Farms Ln
- 862 W Weaver Ln
- 102 Ellison St
- 227 S Angel St Unit 408
- 2025 W Orchard Harvest Dr
- 1932 W 200 N
- 740 W Gentile St
- 790 W Gentile St
- 289 E 900 S