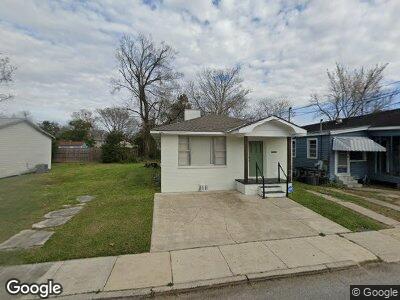
737 S 17th St Baton Rouge, LA 70802
Garden District NeighborhoodEstimated Value: $69,000 - $248,000
2
Beds
1
Bath
1,157
Sq Ft
$132/Sq Ft
Est. Value
About This Home
This home is located at 737 S 17th St, Baton Rouge, LA 70802 and is currently estimated at $152,798, approximately $132 per square foot. 737 S 17th St is a home located in East Baton Rouge Parish with nearby schools including The Dufrocq School, Westdale Middle School, and Mckinley Senior High School.
Ownership History
Date
Name
Owned For
Owner Type
Purchase Details
Closed on
Nov 12, 2024
Sold by
Good Faith Investments Llc
Bought by
Pourciau Ryan and Pourciau Jennifer
Current Estimated Value
Home Financials for this Owner
Home Financials are based on the most recent Mortgage that was taken out on this home.
Original Mortgage
$120,000
Outstanding Balance
$119,648
Interest Rate
6.12%
Mortgage Type
New Conventional
Estimated Equity
$32,252
Purchase Details
Closed on
Oct 5, 2023
Sold by
Renov8 La Llc
Bought by
Good Faith Investments Llc
Home Financials for this Owner
Home Financials are based on the most recent Mortgage that was taken out on this home.
Original Mortgage
$60,000
Interest Rate
7.57%
Mortgage Type
New Conventional
Purchase Details
Closed on
Sep 27, 2022
Sold by
Henderson Lee Wesley and Chandra Hawkins
Bought by
Renov8 La Llc
Purchase Details
Closed on
Jan 21, 2000
Sold by
Henderson Levi Anthony
Bought by
Henderson Lee Wesley
Create a Home Valuation Report for This Property
The Home Valuation Report is an in-depth analysis detailing your home's value as well as a comparison with similar homes in the area
Home Values in the Area
Average Home Value in this Area
Purchase History
| Date | Buyer | Sale Price | Title Company |
|---|---|---|---|
| Pourciau Ryan | -- | None Listed On Document | |
| Pourciau Ryan | -- | None Listed On Document | |
| Good Faith Investments Llc | $35,000 | None Listed On Document | |
| Henderson Lee Wesley | -- | -- |
Source: Public Records
Mortgage History
| Date | Status | Borrower | Loan Amount |
|---|---|---|---|
| Open | Pourciau Ryan | $120,000 | |
| Closed | Pourciau Ryan | $120,000 |
Source: Public Records
Tax History Compared to Growth
Tax History
| Year | Tax Paid | Tax Assessment Tax Assessment Total Assessment is a certain percentage of the fair market value that is determined by local assessors to be the total taxable value of land and additions on the property. | Land | Improvement |
|---|---|---|---|---|
| 2024 | $3,040 | $25,952 | $952 | $25,000 |
| 2023 | $3,040 | $4,510 | $850 | $3,660 |
| 2022 | $539 | $4,510 | $220 | $4,290 |
| 2021 | $526 | $4,510 | $220 | $4,290 |
| 2020 | $523 | $4,510 | $220 | $4,290 |
| 2019 | $497 | $4,100 | $200 | $3,900 |
| 2018 | $490 | $4,100 | $200 | $3,900 |
| 2017 | $490 | $4,100 | $200 | $3,900 |
| 2016 | $478 | $4,100 | $200 | $3,900 |
| 2015 | $467 | $4,000 | $200 | $3,800 |
| 2014 | $465 | $4,000 | $200 | $3,800 |
| 2013 | -- | $4,000 | $200 | $3,800 |
Source: Public Records
Map
Nearby Homes
- 1717 Oleander St
- 818 Park Blvd
- 1532 Bynum Ave
- 710 Park Blvd Unit 1
- 1818 Wisteria St
- 1924 Cherokee St
- 1030 Park Blvd
- 1805 Myrtle Walk
- 1955 Cherokee St
- 1934 Wisteria St
- 1600 Myrtle Walk
- 1023 Park Blvd
- 1025 S 15th St
- 730 Camelia Ave
- 2029 Oleander St
- 1204 S 18th St
- 2005 Wisteria St
- 1235 S 17th St
- 1812 Spain St
- 633 Camelia Ave