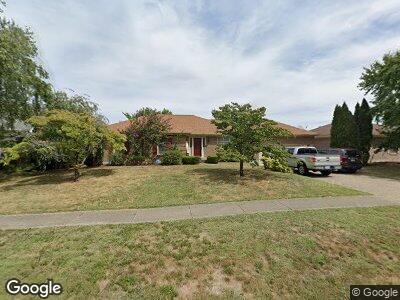
7411 Old N Church Rd Louisville, KY 40214
Auburndale NeighborhoodEstimated Value: $369,108 - $390,000
--
Bed
2
Baths
1,715
Sq Ft
$221/Sq Ft
Est. Value
About This Home
This home is located at 7411 Old N Church Rd, Louisville, KY 40214 and is currently estimated at $379,027, approximately $221 per square foot. 7411 Old N Church Rd is a home located in Jefferson County with nearby schools including Auburndale Elementary School, Coral Ridge Elementary School, and Minors Lane Elementary School.
Ownership History
Date
Name
Owned For
Owner Type
Purchase Details
Closed on
Feb 28, 2022
Sold by
Aguiar Barrera Ronny and Lopez Miladys
Bought by
Hall Holly B and Hall Delmer
Current Estimated Value
Home Financials for this Owner
Home Financials are based on the most recent Mortgage that was taken out on this home.
Original Mortgage
$300,000
Outstanding Balance
$282,768
Interest Rate
3.55%
Mortgage Type
New Conventional
Estimated Equity
$88,776
Purchase Details
Closed on
Dec 27, 2018
Sold by
Perrone Neumann
Bought by
Barrera Ronny Aguiar and Morales Miladys Lopaz
Home Financials for this Owner
Home Financials are based on the most recent Mortgage that was taken out on this home.
Original Mortgage
$227,525
Interest Rate
4.9%
Mortgage Type
New Conventional
Purchase Details
Closed on
Apr 21, 2006
Sold by
Lawhorn Gary L and Lawhorn Vicki P
Bought by
Butler Norma J
Create a Home Valuation Report for This Property
The Home Valuation Report is an in-depth analysis detailing your home's value as well as a comparison with similar homes in the area
Home Values in the Area
Average Home Value in this Area
Purchase History
| Date | Buyer | Sale Price | Title Company |
|---|---|---|---|
| Hall Holly B | $338,000 | Executive Title | |
| Barrera Ronny Aguiar | $239,500 | None Available | |
| Butler Norma J | $214,000 | Agency Title |
Source: Public Records
Mortgage History
| Date | Status | Borrower | Loan Amount |
|---|---|---|---|
| Open | Hall Holly B | $300,000 | |
| Previous Owner | Barrera Ronny Aguiar | $219,000 | |
| Previous Owner | Barrera Ronny Aguiar | $227,525 | |
| Previous Owner | Butler Norma J | $120,000 |
Source: Public Records
Tax History Compared to Growth
Tax History
| Year | Tax Paid | Tax Assessment Tax Assessment Total Assessment is a certain percentage of the fair market value that is determined by local assessors to be the total taxable value of land and additions on the property. | Land | Improvement |
|---|---|---|---|---|
| 2024 | $3,600 | $338,000 | $26,000 | $312,000 |
| 2023 | $3,711 | $338,000 | $26,000 | $312,000 |
| 2022 | $2,957 | $268,350 | $26,000 | $242,350 |
| 2021 | $3,192 | $268,350 | $26,000 | $242,350 |
| 2020 | $2,651 | $239,500 | $40,000 | $199,500 |
| 2019 | $2,596 | $239,500 | $40,000 | $199,500 |
| 2018 | $1,935 | $218,400 | $40,000 | $178,400 |
| 2017 | $1,898 | $218,400 | $40,000 | $178,400 |
| 2013 | $2,051 | $205,050 | $35,000 | $170,050 |
Source: Public Records
Map
Nearby Homes
- 7303 Olde Nantucket Cove
- 221 Mcbroom Dr
- 304 Scottsdale Blvd
- 405 Kenny Blvd
- 7601 Eagle Landing Way Unit 7601
- 9400 Minute Men Ct
- 309 Kenny Blvd
- 9406 Minute Men Ct
- 518 Eagle Pointe Dr
- 7630 Eagle Landing Way
- 8106 Rocky Gap Rd
- 513 Auburn Oaks Dr
- 5663 W Indian Trail
- 9013 Auburn Woods Rd
- 7624 Auburn Oaks Ct
- 301 Harpers Ferry Rd
- 116 Woodmore Ave
- 5512 Mae Ct
- 325 Chris Dr
- 422 Downes Ln