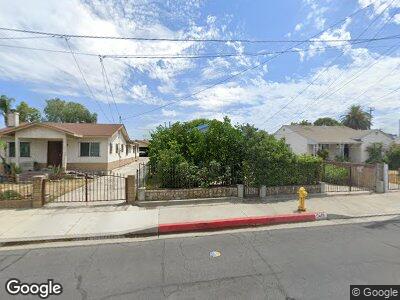
7416 Newmark Ave Rosemead, CA 91770
Estimated Value: $717,000 - $791,000
2
Beds
1
Bath
788
Sq Ft
$957/Sq Ft
Est. Value
About This Home
This home is located at 7416 Newmark Ave, Rosemead, CA 91770 and is currently estimated at $754,324, approximately $957 per square foot. 7416 Newmark Ave is a home located in Los Angeles County with nearby schools including Bitely (Arlene) Elementary School, Garvey (Richard) Intermediate School, and San Gabriel High School.
Ownership History
Date
Name
Owned For
Owner Type
Purchase Details
Closed on
Jan 27, 2025
Sold by
Shein Swe Chu and Shein Swe Shu
Bought by
Wongklom Wirut and Wongklon Wirut
Current Estimated Value
Purchase Details
Closed on
May 24, 2016
Sold by
Shein Yee Min
Bought by
Wongklon Wirut and Shein Swe Chu
Purchase Details
Closed on
Jan 17, 2002
Sold by
Shein Swe Chu
Bought by
Shein Yee Min and Wongklom Wirut
Home Financials for this Owner
Home Financials are based on the most recent Mortgage that was taken out on this home.
Original Mortgage
$108,000
Interest Rate
7.11%
Purchase Details
Closed on
Oct 25, 1996
Sold by
Chen Hsing H
Bought by
Shein Swe Chu and Shein Yee Min
Home Financials for this Owner
Home Financials are based on the most recent Mortgage that was taken out on this home.
Original Mortgage
$110,000
Interest Rate
8.11%
Create a Home Valuation Report for This Property
The Home Valuation Report is an in-depth analysis detailing your home's value as well as a comparison with similar homes in the area
Home Values in the Area
Average Home Value in this Area
Purchase History
| Date | Buyer | Sale Price | Title Company |
|---|---|---|---|
| Wongklon Wirut | -- | Accommodation | |
| Shein Yee Min | -- | Commerce Title | |
| Shein Swe Chu | $126,000 | -- |
Source: Public Records
Mortgage History
| Date | Status | Borrower | Loan Amount |
|---|---|---|---|
| Previous Owner | Shein Yee Min | $220,000 | |
| Previous Owner | Shein Yee Min | $90,000 | |
| Previous Owner | Shein Yee Min | $100,000 | |
| Previous Owner | Shein Yee Min | $35,000 | |
| Previous Owner | Shein Yee Min | $108,000 | |
| Previous Owner | Shein Swe Chu | $110,000 |
Source: Public Records
Tax History Compared to Growth
Tax History
| Year | Tax Paid | Tax Assessment Tax Assessment Total Assessment is a certain percentage of the fair market value that is determined by local assessors to be the total taxable value of land and additions on the property. | Land | Improvement |
|---|---|---|---|---|
| 2024 | $2,922 | $201,165 | $140,822 | $60,343 |
| 2023 | $2,820 | $197,221 | $138,061 | $59,160 |
| 2022 | $2,696 | $193,354 | $135,354 | $58,000 |
| 2021 | $2,681 | $189,563 | $132,700 | $56,863 |
| 2019 | $2,587 | $183,942 | $128,765 | $55,177 |
| 2018 | $2,513 | $180,337 | $126,241 | $54,096 |
| 2016 | $2,316 | $173,337 | $121,340 | $51,997 |
| 2015 | $2,279 | $170,734 | $119,518 | $51,216 |
| 2014 | $2,257 | $167,390 | $117,177 | $50,213 |
Source: Public Records
Map
Nearby Homes
- 825 E Newmark Ave Unit A
- 7531 Wilmar Place
- 425 Pomelo Ave Unit F
- 2517 Daroca Ave
- 7809 E Emerson Ave
- 2203 Kays Ave
- 411 Sefton Ave Unit C
- 424 E Newmark Ave Unit B
- 400 S Alhambra Ave
- 519 Sefton Ave Unit D
- 521 Sefton Ave Unit E
- 321 N Orange Ave Unit 209
- 531 Sefton Ave
- 7735 Graves Ave
- 7322 Mooney Dr
- 2615 Strathmore Ave
- 7303 Teresa Ave
- 7428 Mooney Dr
- 425 N Rural Dr
- 501 N Rural Dr