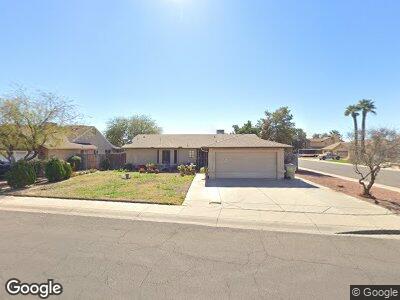
7421 W Denton Ln Glendale, AZ 85303
La Fontana Heights NeighborhoodEstimated Value: $360,479 - $451,000
--
Bed
3
Baths
1,527
Sq Ft
$269/Sq Ft
Est. Value
About This Home
This home is located at 7421 W Denton Ln, Glendale, AZ 85303 and is currently estimated at $410,120, approximately $268 per square foot. 7421 W Denton Ln is a home located in Maricopa County with nearby schools including Bicentennial South School, Independence High School, and Camelback Academy.
Ownership History
Date
Name
Owned For
Owner Type
Purchase Details
Closed on
Dec 8, 2021
Sold by
Travis Geraldine W and Geraldine W Travis Family Trus
Bought by
Travis Gerald S and Travis Geraldine W
Current Estimated Value
Home Financials for this Owner
Home Financials are based on the most recent Mortgage that was taken out on this home.
Original Mortgage
$274,000
Interest Rate
3.14%
Mortgage Type
New Conventional
Purchase Details
Closed on
Jun 26, 2006
Sold by
Travis Geraldine W
Bought by
Travis Geraldine W and Geraldine W Travis Family Trust
Purchase Details
Closed on
Dec 22, 2005
Sold by
Travis William Alexander and Travis Geraldine W
Bought by
Travis Geraldine W
Home Financials for this Owner
Home Financials are based on the most recent Mortgage that was taken out on this home.
Original Mortgage
$337,500
Interest Rate
5.84%
Mortgage Type
FHA
Create a Home Valuation Report for This Property
The Home Valuation Report is an in-depth analysis detailing your home's value as well as a comparison with similar homes in the area
Home Values in the Area
Average Home Value in this Area
Purchase History
| Date | Buyer | Sale Price | Title Company |
|---|---|---|---|
| Travis Gerald S | -- | Amrock Inc | |
| Travis Geraldine W | -- | None Available |
Source: Public Records
Mortgage History
| Date | Status | Borrower | Loan Amount |
|---|---|---|---|
| Closed | Travis Gerald S | $274,000 | |
| Closed | Travis Geraldine W | $337,500 | |
| Closed | Travis William Alexander | $121,000 | |
| Closed | Travis William Alexander | $28,000 |
Source: Public Records
Tax History Compared to Growth
Tax History
| Year | Tax Paid | Tax Assessment Tax Assessment Total Assessment is a certain percentage of the fair market value that is determined by local assessors to be the total taxable value of land and additions on the property. | Land | Improvement |
|---|---|---|---|---|
| 2025 | $1,131 | $9,557 | -- | -- |
| 2024 | $1,026 | $9,102 | -- | -- |
| 2023 | $1,026 | $28,500 | $5,700 | $22,800 |
| 2022 | $1,020 | $21,550 | $4,310 | $17,240 |
| 2021 | $1,016 | $19,310 | $3,860 | $15,450 |
| 2020 | $1,028 | $18,860 | $3,770 | $15,090 |
| 2019 | $1,667 | $16,230 | $3,240 | $12,990 |
| 2018 | $975 | $14,180 | $2,830 | $11,350 |
| 2017 | $989 | $12,720 | $2,540 | $10,180 |
| 2016 | $939 | $12,070 | $2,410 | $9,660 |
| 2015 | $885 | $9,820 | $1,960 | $7,860 |
Source: Public Records
Map
Nearby Homes
- 5430 N 74th Ave
- 5361 N 77th Ln
- 7228 W Luke Ave
- 7141 W Denton Ln
- 7132 W Vermont Ave
- 7572 W Pasadena Ave
- 5308 N 77th Dr
- 7737 W Medlock Dr
- 7465 W Rancho Dr
- 7359 W Rancho Dr
- 5007 N 71st Dr
- 5415 N 79th Dr
- 7334 W Bethany Home Rd
- 5602 N 69th Dr
- 7433 W Rovey Ave
- 7410 W Rovey Ave
- 7418 W Rovey Ave
- 7952 W Oregon Ave
- 7922 W Pasadena Ave
- 7423 W Cavalier Dr