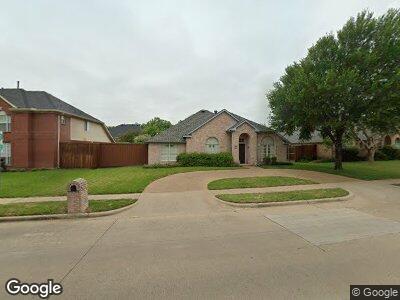
7425 Oak Ridge Dr Plano, TX 75025
Watters Creek NeighborhoodEstimated Value: $492,030 - $574,000
4
Beds
2
Baths
2,529
Sq Ft
$214/Sq Ft
Est. Value
About This Home
This home is located at 7425 Oak Ridge Dr, Plano, TX 75025 and is currently estimated at $542,008, approximately $214 per square foot. 7425 Oak Ridge Dr is a home located in Collin County with nearby schools including Rasor Elementary School, Hendrick Middle School, and Clark High School.
Ownership History
Date
Name
Owned For
Owner Type
Purchase Details
Closed on
Nov 28, 2006
Sold by
Reddert Robert F and Reddert Karin A
Bought by
Miles Susie L
Current Estimated Value
Home Financials for this Owner
Home Financials are based on the most recent Mortgage that was taken out on this home.
Original Mortgage
$75,000
Interest Rate
6.37%
Mortgage Type
Purchase Money Mortgage
Purchase Details
Closed on
Nov 12, 1996
Sold by
Legacy Homes Ltd
Bought by
Reddert Robert F and Reddert Karin A
Home Financials for this Owner
Home Financials are based on the most recent Mortgage that was taken out on this home.
Original Mortgage
$150,900
Interest Rate
8.05%
Purchase Details
Closed on
Jun 19, 1996
Sold by
Chase Oaks Ltd
Bought by
Legacy Homes Ltd
Home Financials for this Owner
Home Financials are based on the most recent Mortgage that was taken out on this home.
Original Mortgage
$25,000,000
Interest Rate
8.24%
Create a Home Valuation Report for This Property
The Home Valuation Report is an in-depth analysis detailing your home's value as well as a comparison with similar homes in the area
Home Values in the Area
Average Home Value in this Area
Purchase History
| Date | Buyer | Sale Price | Title Company |
|---|---|---|---|
| Miles Susie L | -- | None Available | |
| Reddert Robert F | -- | -- | |
| Legacy Homes Ltd | -- | -- |
Source: Public Records
Mortgage History
| Date | Status | Borrower | Loan Amount |
|---|---|---|---|
| Open | Miles Susie L | $45,621 | |
| Closed | Miles Susie L | $67,349 | |
| Closed | Miles Susie L | $75,000 | |
| Previous Owner | Reddert Robert F | $145,060 | |
| Previous Owner | Reddert Robert F | $150,900 | |
| Previous Owner | Legacy Homes Ltd | $25,000,000 |
Source: Public Records
Tax History Compared to Growth
Tax History
| Year | Tax Paid | Tax Assessment Tax Assessment Total Assessment is a certain percentage of the fair market value that is determined by local assessors to be the total taxable value of land and additions on the property. | Land | Improvement |
|---|---|---|---|---|
| 2023 | $5,445 | $379,190 | $120,000 | $390,191 |
| 2022 | $6,588 | $344,718 | $120,000 | $294,678 |
| 2021 | $6,319 | $313,380 | $95,000 | $218,380 |
| 2020 | $6,279 | $307,532 | $95,000 | $212,532 |
| 2019 | $6,726 | $311,209 | $95,000 | $216,209 |
| 2018 | $6,340 | $290,881 | $85,000 | $208,844 |
| 2017 | $5,764 | $290,477 | $75,000 | $215,477 |
| 2016 | $5,306 | $255,422 | $70,000 | $185,422 |
| 2015 | $4,043 | $237,927 | $63,000 | $174,927 |
Source: Public Records
Map
Nearby Homes
- 640 Forest Bend Dr
- 604 Nelson Ct
- 733 Pine Lakes Dr
- 7436 Stoney Point Dr
- 801 Sandhurst Dr
- 7312 Stoney Point Dr
- 832 Baxter Dr
- 7304 Stoney Point Dr
- 717 Sunkist Ln
- 916 Filmore Dr
- 708 Sunkist Ln
- 8104 Greensboro Dr
- 1012 Gannon Dr
- 1137 Caleb Dr
- 912 Leonard Ln
- 913 Leonard Ln
- 8105 Davidson Dr
- 929 Sydney Ln
- 1000 Hedgcoxe Rd
- 7128 Wolfemont Ln