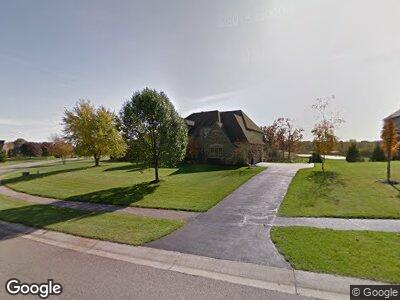
7433 Ingomar Ln Unit 36 Clarkston, MI 48348
Estimated Value: $791,684 - $886,000
4
Beds
4
Baths
4,000
Sq Ft
$210/Sq Ft
Est. Value
About This Home
This home is located at 7433 Ingomar Ln Unit 36, Clarkston, MI 48348 and is currently estimated at $838,421, approximately $209 per square foot. 7433 Ingomar Ln Unit 36 is a home located in Oakland County with nearby schools including Springfield Christian Academy.
Ownership History
Date
Name
Owned For
Owner Type
Purchase Details
Closed on
Jun 23, 2010
Sold by
Howe Christopher G and Howe Kim
Bought by
Suida Mitchel and Suida Suzanne
Current Estimated Value
Home Financials for this Owner
Home Financials are based on the most recent Mortgage that was taken out on this home.
Original Mortgage
$268,000
Interest Rate
4.77%
Mortgage Type
New Conventional
Purchase Details
Closed on
Apr 20, 2010
Sold by
Howe Christopher G and Howe Kimberly
Bought by
Hsbc Bank Usa National Association
Purchase Details
Closed on
Oct 25, 2006
Sold by
Babcock Development Co Inc
Bought by
Howe Christopher G
Home Financials for this Owner
Home Financials are based on the most recent Mortgage that was taken out on this home.
Original Mortgage
$460,000
Interest Rate
1%
Mortgage Type
Purchase Money Mortgage
Create a Home Valuation Report for This Property
The Home Valuation Report is an in-depth analysis detailing your home's value as well as a comparison with similar homes in the area
Home Values in the Area
Average Home Value in this Area
Purchase History
| Date | Buyer | Sale Price | Title Company |
|---|---|---|---|
| Suida Mitchel | $335,000 | Philip R Seaver Title Co Inc | |
| Hsbc Bank Usa National Association | $345,000 | None Available | |
| Howe Christopher G | -- | Philip R Seaver Title Co Inc | |
| Howe Christopher G | $91,300 | Philip R Seaver Title Co Inc | |
| Howe Christopher G | -- | Philip R Seaver Title Co Inc |
Source: Public Records
Mortgage History
| Date | Status | Borrower | Loan Amount |
|---|---|---|---|
| Open | Suida Mitchel | $258,000 | |
| Closed | Suida Mitchel | $267,000 | |
| Closed | Suida Mitchel | $268,000 | |
| Previous Owner | Howe Christopher G | $501,600 | |
| Previous Owner | Howe Christopher G | $460,000 |
Source: Public Records
Tax History Compared to Growth
Tax History
| Year | Tax Paid | Tax Assessment Tax Assessment Total Assessment is a certain percentage of the fair market value that is determined by local assessors to be the total taxable value of land and additions on the property. | Land | Improvement |
|---|---|---|---|---|
| 2024 | $5,252 | $344,650 | $0 | $0 |
| 2023 | $5,009 | $290,370 | $0 | $0 |
| 2022 | $6,948 | $278,350 | $0 | $0 |
| 2021 | $6,389 | $280,640 | $0 | $0 |
| 2020 | $4,585 | $267,500 | $0 | $0 |
| 2018 | $6,180 | $237,900 | $31,400 | $206,500 |
| 2015 | -- | $234,900 | $0 | $0 |
| 2014 | -- | $217,700 | $0 | $0 |
| 2011 | -- | $173,100 | $0 | $0 |
Source: Public Records
Map
Nearby Homes
- 9506 Kingsway Cir
- 9829 Forest Ridge Dr
- 9874 Kings Valley Unit 31
- 7220 Bluewater Dr Unit 140
- 7310 Bluewater Dr Unit 117
- 9316 Lakebluff Dr
- 6660 Ridgewood Rd
- 9765 Dixie Hwy
- 00 Davisburg Rd
- 9144 Big Lake Rd
- 9804 King Rd
- 9850 Rilton
- 9818 King Rd
- 9832 King Rd
- 8309 High Meadow Trail
- 8481 Holcomb Rd
- 6705 College Park
- 9876 Dixie Hwy
- 9916 King Rd Unit 13
- 10001 Quarry Ridge Rd