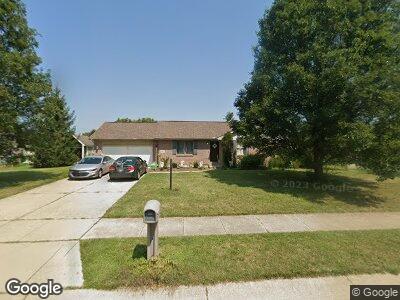
7474 Dian Dr Franklin, OH 45005
Carlisle NeighborhoodEstimated Value: $276,000 - $309,947
3
Beds
2
Baths
1,228
Sq Ft
$241/Sq Ft
Est. Value
About This Home
This home is located at 7474 Dian Dr, Franklin, OH 45005 and is currently estimated at $295,737, approximately $240 per square foot. 7474 Dian Dr is a home located in Warren County with nearby schools including Alden R Brown Elementary School, Chamberlain Middle School, and Carlisle High School.
Ownership History
Date
Name
Owned For
Owner Type
Purchase Details
Closed on
Apr 30, 2021
Sold by
Wilson Matthew and Wilson Jessica
Bought by
Brinkman Todd Alan and Meehan Anita
Current Estimated Value
Home Financials for this Owner
Home Financials are based on the most recent Mortgage that was taken out on this home.
Original Mortgage
$250,381
Outstanding Balance
$229,780
Interest Rate
3.1%
Mortgage Type
New Conventional
Estimated Equity
$68,120
Purchase Details
Closed on
Apr 26, 2007
Sold by
Hud
Bought by
Wilson Matthew and Setser Jessica
Home Financials for this Owner
Home Financials are based on the most recent Mortgage that was taken out on this home.
Original Mortgage
$101,200
Interest Rate
6.2%
Mortgage Type
Purchase Money Mortgage
Purchase Details
Closed on
May 4, 2000
Sold by
Morris Robert G
Bought by
Towery Robert E and Towery Elizabeth J
Home Financials for this Owner
Home Financials are based on the most recent Mortgage that was taken out on this home.
Original Mortgage
$135,384
Interest Rate
8.24%
Mortgage Type
FHA
Create a Home Valuation Report for This Property
The Home Valuation Report is an in-depth analysis detailing your home's value as well as a comparison with similar homes in the area
Home Values in the Area
Average Home Value in this Area
Purchase History
| Date | Buyer | Sale Price | Title Company |
|---|---|---|---|
| Brinkman Todd Alan | $255,000 | First American Title | |
| Wilson Matthew | $126,500 | Lakeside Title & Escrow | |
| Towery Robert E | $136,500 | -- |
Source: Public Records
Mortgage History
| Date | Status | Borrower | Loan Amount |
|---|---|---|---|
| Open | Meehan Anita | $40,000 | |
| Open | Brinkman Todd Alan | $250,381 | |
| Previous Owner | Wilson Matthew | $101,200 | |
| Previous Owner | Towery Robert E | $143,509 | |
| Previous Owner | Towery Robert E | $135,384 |
Source: Public Records
Tax History Compared to Growth
Tax History
| Year | Tax Paid | Tax Assessment Tax Assessment Total Assessment is a certain percentage of the fair market value that is determined by local assessors to be the total taxable value of land and additions on the property. | Land | Improvement |
|---|---|---|---|---|
| 2024 | $3,623 | $94,550 | $21,000 | $73,550 |
| 2023 | $3,030 | $71,456 | $11,812 | $59,643 |
| 2022 | $3,010 | $71,456 | $11,813 | $59,644 |
| 2021 | $2,906 | $71,456 | $11,813 | $59,644 |
| 2020 | $2,638 | $47,621 | $9,450 | $38,171 |
| 2019 | $2,598 | $47,621 | $9,450 | $38,171 |
| 2018 | $2,807 | $47,621 | $9,450 | $38,171 |
| 2017 | $2,488 | $41,899 | $8,449 | $33,450 |
| 2016 | $1,876 | $41,899 | $8,449 | $33,450 |
| 2015 | $2,198 | $41,899 | $8,449 | $33,450 |
| 2014 | $1,814 | $40,680 | $8,200 | $32,480 |
| 2013 | $1,808 | $52,080 | $10,500 | $41,580 |
Source: Public Records
Map
Nearby Homes
- 6509 Junior Ct
- 7762 Dian Ave
- 185 Baker Ln
- 1070 Dubois Rd
- 120 Cousins Dr
- 10 Timber Creek Ct
- 20 Timber Creek Ct
- 40 Timber Creek Ct
- 30 Timber Creek Ct
- 1227 Waterbury Dr
- 1213 Waterbury Dr
- 1223 Waterbury Dr
- 1605 Ashbury Ct
- 533 Clay St
- 732 Central Ave
- 1320 Ellington Ct
- 122 Eagle Ridge Dr
- 409 Lincoln Dr
- 1403 Edinburg Ct
- 1419 Edinburg Ct