Estimated Value: $218,160 - $231,000
2
Beds
2
Baths
1,100
Sq Ft
$203/Sq Ft
Est. Value
About This Home
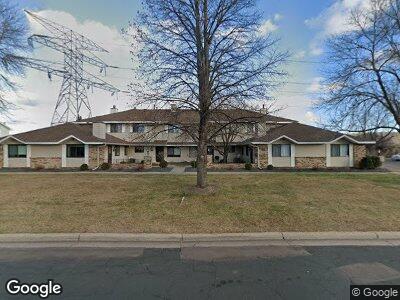
This home is located at 7542 Vinewood Ct, Osseo, MN 55311 and is currently estimated at $223,790, approximately $203 per square foot. 7542 Vinewood Ct is a home located in Hennepin County with nearby schools including Oak View Elementary School, Maple Grove Middle School, and Maple Grove Senior High School.
Ownership History
Date
Name
Owned For
Owner Type
Purchase Details
Closed on
Jan 9, 2025
Sold by
Cummens Samantha
Bought by
Bell Bank
Current Estimated Value
Purchase Details
Closed on
Nov 22, 2024
Sold by
Blackstone 1 Llc
Bought by
Riddhi Group Llc
Purchase Details
Closed on
Oct 16, 2024
Sold by
Cummens Samantha and Bauer Samantha
Bought by
Blackstone 1 Llc
Purchase Details
Closed on
May 21, 2024
Sold by
Cummens Samantha
Bought by
Parkwood Townhms Assn Inc
Purchase Details
Closed on
Sep 12, 2018
Sold by
Jatko David M and Jatko Kimberly
Bought by
Cummens Samantha
Home Financials for this Owner
Home Financials are based on the most recent Mortgage that was taken out on this home.
Original Mortgage
$151,210
Interest Rate
4.62%
Mortgage Type
FHA
Purchase Details
Closed on
Aug 30, 2002
Sold by
Bauer Theresa M
Bought by
Jatko David
Create a Home Valuation Report for This Property
The Home Valuation Report is an in-depth analysis detailing your home's value as well as a comparison with similar homes in the area
Home Values in the Area
Average Home Value in this Area
Purchase History
| Date | Buyer | Sale Price | Title Company |
|---|---|---|---|
| Bell Bank | $116,100 | -- | |
| Bell Bank | $116,100 | -- | |
| Riddhi Group Llc | $18,000 | -- | |
| Blackstone 1 Llc | $500 | West Title | |
| Parkwood Townhms Assn Inc | -- | -- | |
| Cummens Samantha | $154,000 | All American Title Co Inc | |
| Jatko David | $146,900 | -- |
Source: Public Records
Mortgage History
| Date | Status | Borrower | Loan Amount |
|---|---|---|---|
| Previous Owner | Cummens Samantha | $159,700 | |
| Previous Owner | Cummens Samantha | $151,210 | |
| Previous Owner | Cummens Samantha | $8,700 | |
| Previous Owner | Jatko David | $134,600 | |
| Previous Owner | Jatko David M | $139,650 |
Source: Public Records
Tax History Compared to Growth
Tax History
| Year | Tax Paid | Tax Assessment Tax Assessment Total Assessment is a certain percentage of the fair market value that is determined by local assessors to be the total taxable value of land and additions on the property. | Land | Improvement |
|---|---|---|---|---|
| 2023 | $2,653 | $195,700 | $63,500 | $132,200 |
| 2022 | $1,789 | $190,100 | $50,600 | $139,500 |
| 2021 | $1,676 | $165,800 | $43,600 | $122,200 |
| 2020 | $1,645 | $154,700 | $37,000 | $117,700 |
| 2019 | $1,550 | $145,900 | $36,700 | $109,200 |
| 2018 | $1,722 | $132,800 | $31,800 | $101,000 |
| 2017 | $1,589 | $108,500 | $23,500 | $85,000 |
| 2016 | $1,450 | $97,600 | $16,500 | $81,100 |
| 2015 | $1,448 | $94,800 | $20,000 | $74,800 |
| 2014 | -- | $81,000 | $15,000 | $66,000 |
Source: Public Records
Map
Nearby Homes
- 7513 Vinewood Ct Unit N
- 7635 Wedgewood Ct N Unit 7615
- 7564 E Fish Lake Rd
- 7511 Zinnia Way
- 7201 Vinewood Ln N
- 12592 74th Ave N
- 13990 76th Ave N
- 7212 Maplewood Dr
- 12438 74th Ave N Unit 82
- 7415 Fernbrook Ln N
- 7002 Crest Dr
- 13957 81st Ave N Unit 15
- 7264 Kirkwood Ln N
- 8041 Chesshire Ln N
- 8026 Magnolia Ln N Unit 169
- 6838 Chesshire Ln N
- 7860 Juneau Ln N
- 8083 Magnolia Ln N
- 7879 Juneau Ln N
- 8140 Magnolia Ln N