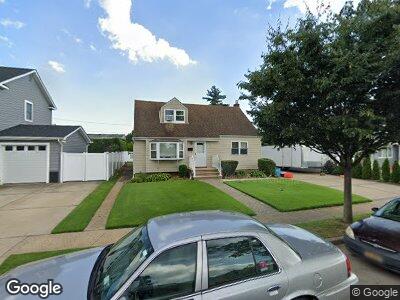
755 Forte Blvd Franklin Square, NY 11010
Franklin Square NeighborhoodEstimated Value: $703,157 - $773,000
--
Bed
1
Bath
1,408
Sq Ft
$524/Sq Ft
Est. Value
About This Home
This home is located at 755 Forte Blvd, Franklin Square, NY 11010 and is currently estimated at $738,079, approximately $524 per square foot. 755 Forte Blvd is a home located in Nassau County with nearby schools including Hebrew Academy of Nassau County (HANC).
Ownership History
Date
Name
Owned For
Owner Type
Purchase Details
Closed on
Mar 27, 2007
Sold by
Berg Irene
Current Estimated Value
Create a Home Valuation Report for This Property
The Home Valuation Report is an in-depth analysis detailing your home's value as well as a comparison with similar homes in the area
Home Values in the Area
Average Home Value in this Area
Purchase History
| Date | Buyer | Sale Price | Title Company |
|---|---|---|---|
| -- | -- | -- |
Source: Public Records
Tax History Compared to Growth
Tax History
| Year | Tax Paid | Tax Assessment Tax Assessment Total Assessment is a certain percentage of the fair market value that is determined by local assessors to be the total taxable value of land and additions on the property. | Land | Improvement |
|---|---|---|---|---|
| 2024 | $3,924 | $533 | $294 | $239 |
| 2023 | $7,830 | $533 | $294 | $239 |
| 2022 | $7,830 | $533 | $294 | $239 |
| 2021 | $7,503 | $524 | $289 | $235 |
| 2020 | $3,567 | $680 | $509 | $171 |
| 2019 | $3,983 | $729 | $439 | $290 |
| 2018 | $4,010 | $907 | $0 | $0 |
| 2017 | $1,409 | $907 | $546 | $361 |
| 2016 | $4,995 | $907 | $546 | $361 |
| 2015 | $3,224 | $907 | $546 | $361 |
| 2014 | $3,224 | $907 | $546 | $361 |
| 2013 | $2,898 | $877 | $546 | $331 |
Source: Public Records
Map
Nearby Homes
- 796 Hancock Ave
- 417 Jefferson St
- 924 Van Buren Ave
- 934 Hancock St
- 257 Claflin Blvd
- 646 Baldwin Dr
- 274 Semton Blvd
- 899 Oaks Dr
- 271 Semton Blvd
- 249 Hoffman St
- 911 First Ave
- 897 Second Ave
- 745 Anderson Ave
- 223 Guildford Ct
- 591 Seminole Rd
- 698 Herman Ave
- 407 Saint Luke Place
- 1022 Lorraine Dr
- 978 Fenworth Blvd
- 1053 Lorraine Dr