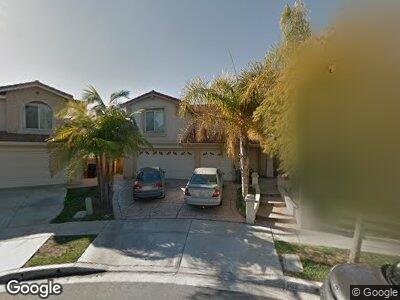
762 Silver Shoals Point San Diego, CA 92154
Ocean View Hills NeighborhoodEstimated Value: $951,145 - $1,002,000
4
Beds
3
Baths
2,231
Sq Ft
$436/Sq Ft
Est. Value
About This Home
This home is located at 762 Silver Shoals Point, San Diego, CA 92154 and is currently estimated at $972,036, approximately $435 per square foot. 762 Silver Shoals Point is a home located in San Diego County with nearby schools including Ocean View Hills, Vista Del Mar, and San Ysidro Middle School.
Ownership History
Date
Name
Owned For
Owner Type
Purchase Details
Closed on
Jan 25, 1999
Sold by
Pardee Construction Company
Bought by
Rabago Francisco and Rabago Hortencia
Current Estimated Value
Home Financials for this Owner
Home Financials are based on the most recent Mortgage that was taken out on this home.
Original Mortgage
$182,800
Interest Rate
6.98%
Create a Home Valuation Report for This Property
The Home Valuation Report is an in-depth analysis detailing your home's value as well as a comparison with similar homes in the area
Home Values in the Area
Average Home Value in this Area
Purchase History
| Date | Buyer | Sale Price | Title Company |
|---|---|---|---|
| Rabago Francisco | $229,000 | Chicago Title |
Source: Public Records
Mortgage History
| Date | Status | Borrower | Loan Amount |
|---|---|---|---|
| Open | Rabago Francisco J | $150,000 | |
| Closed | Rabago Francisco | $179,000 | |
| Previous Owner | Rabago Francisco | $182,800 |
Source: Public Records
Tax History Compared to Growth
Tax History
| Year | Tax Paid | Tax Assessment Tax Assessment Total Assessment is a certain percentage of the fair market value that is determined by local assessors to be the total taxable value of land and additions on the property. | Land | Improvement |
|---|---|---|---|---|
| 2024 | $5,281 | $351,176 | $107,577 | $243,599 |
| 2023 | $5,731 | $344,291 | $105,468 | $238,823 |
| 2022 | $5,510 | $337,541 | $103,400 | $234,141 |
| 2021 | $5,506 | $330,923 | $101,373 | $229,550 |
| 2020 | $5,412 | $327,531 | $100,334 | $227,197 |
| 2019 | $5,191 | $321,110 | $98,367 | $222,743 |
| 2018 | $5,100 | $314,815 | $96,439 | $218,376 |
| 2017 | $83 | $308,644 | $94,549 | $214,095 |
| 2016 | $4,866 | $302,594 | $92,696 | $209,898 |
| 2015 | $4,818 | $298,050 | $91,304 | $206,746 |
| 2014 | $4,753 | $292,213 | $89,516 | $202,697 |
Source: Public Records
Map
Nearby Homes
- 5154 Mariner Dr Unit 1
- 475 Marsh Harbor Dr
- 735 Anchor Cove
- 874 Compass Way
- 784 Portside Place
- 823 Fuchsia Ln
- 1210 Jade Cove Ct
- 1205 Caminito Rockfish Unit 53
- 5321 Calle Rockfish Unit 90
- 5160 Calle Sand Arch Unit 79
- 1338 Starry Way Unit 40
- 779 Kedzie Ave
- 321 Rancho Dr Unit 31
- 321 Rancho Dr Unit 46
- 5360 Calle Rockfish Unit 32
- 1200 Calle Seabass Unit 39
- 1441 Paseo Orion
- 5243 Beachfront Cove Unit 125
- 5261 Beachfront Cove Unit 174
- 5240 Beachfront Cove Unit 89