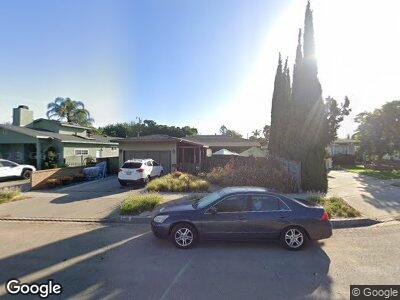
767 N Orange St Orange, CA 92867
Estimated Value: $886,830 - $1,096,000
3
Beds
1
Bath
984
Sq Ft
$1,027/Sq Ft
Est. Value
About This Home
This home is located at 767 N Orange St, Orange, CA 92867 and is currently estimated at $1,010,208, approximately $1,026 per square foot. 767 N Orange St is a home located in Orange County with nearby schools including California iInspire Academy, Yorba Middle School, and Orange High School.
Ownership History
Date
Name
Owned For
Owner Type
Purchase Details
Closed on
Feb 11, 2002
Sold by
Wilson Kristi L and Davis Kristi L
Bought by
Wilson Robert D and Wilson Kristi L
Current Estimated Value
Home Financials for this Owner
Home Financials are based on the most recent Mortgage that was taken out on this home.
Original Mortgage
$103,000
Interest Rate
6.99%
Create a Home Valuation Report for This Property
The Home Valuation Report is an in-depth analysis detailing your home's value as well as a comparison with similar homes in the area
Home Values in the Area
Average Home Value in this Area
Purchase History
| Date | Buyer | Sale Price | Title Company |
|---|---|---|---|
| Wilson Robert D | -- | American Title Co |
Source: Public Records
Mortgage History
| Date | Status | Borrower | Loan Amount |
|---|---|---|---|
| Closed | Wilson Robert D | $147,000 | |
| Closed | Wilson Robert D | $125,000 | |
| Closed | Wilson Robert D | $103,000 |
Source: Public Records
Tax History Compared to Growth
Tax History
| Year | Tax Paid | Tax Assessment Tax Assessment Total Assessment is a certain percentage of the fair market value that is determined by local assessors to be the total taxable value of land and additions on the property. | Land | Improvement |
|---|---|---|---|---|
| 2024 | $1,415 | $103,791 | $63,057 | $40,734 |
| 2023 | $1,379 | $101,756 | $61,820 | $39,936 |
| 2022 | $1,347 | $99,761 | $60,608 | $39,153 |
| 2021 | $1,313 | $97,805 | $59,419 | $38,386 |
| 2020 | $1,300 | $96,803 | $58,810 | $37,993 |
| 2019 | $1,286 | $94,905 | $57,656 | $37,249 |
| 2018 | $1,266 | $93,045 | $56,526 | $36,519 |
| 2017 | $1,220 | $91,221 | $55,418 | $35,803 |
| 2016 | $1,198 | $89,433 | $54,332 | $35,101 |
| 2015 | $1,179 | $88,090 | $53,516 | $34,574 |
| 2014 | $1,152 | $86,365 | $52,468 | $33,897 |
Source: Public Records
Map
Nearby Homes
- 687 N Glassell St
- 347 E Barkley Ave
- 622 E Lomita Ave
- 201 W Collins Ave Unit 48
- 1015 E Oakmont Ave
- 1064 N Cambridge St
- 358 N Shaffer St
- 280 N Cleveland St
- 986 N California St
- 740 E Palm Ave
- 410 N Clark St Unit D
- 1417 N Center St
- 304 N Waverly St
- 1428 N Center St
- 1343 E Orange Grove Ave
- 561 W Maple Ave
- 563 W Maple Ave
- 515 W Maple Ave
- 365 N Magnolia St
- 173 N Waverly St