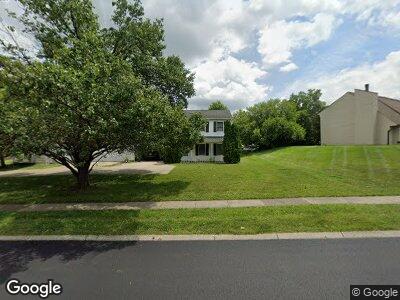
7694 Brams Hill Dr Dayton, OH 45459
Estimated Value: $402,000 - $485,000
3
Beds
3
Baths
3,168
Sq Ft
$135/Sq Ft
Est. Value
About This Home
This home is located at 7694 Brams Hill Dr, Dayton, OH 45459 and is currently estimated at $428,172, approximately $135 per square foot. 7694 Brams Hill Dr is a home located in Montgomery County with nearby schools including Primary Village North, Normandy Elementary School, and Magsig Middle School.
Ownership History
Date
Name
Owned For
Owner Type
Purchase Details
Closed on
Oct 8, 2019
Sold by
Li Elizabeth H and Kwan Manbun
Bought by
Township Properties Llc
Current Estimated Value
Purchase Details
Closed on
Jul 12, 2019
Sold by
Meixner Rose Marie
Bought by
Li Elizabeth H and Kwan Manbun
Home Financials for this Owner
Home Financials are based on the most recent Mortgage that was taken out on this home.
Original Mortgage
$184,000
Interest Rate
3.84%
Mortgage Type
Adjustable Rate Mortgage/ARM
Purchase Details
Closed on
Apr 28, 2015
Sold by
Meixner N Richard and Meixner Rose Marie
Bought by
Meixner Rose Marie and Meixner Rosie Marie
Purchase Details
Closed on
Aug 1, 2006
Sold by
Meixner Rosie Marie
Bought by
Meixner N Richard and Meixner Rosie Marie
Purchase Details
Closed on
May 3, 1996
Sold by
Meixner N Richard
Bought by
Meixner Rose Marie
Create a Home Valuation Report for This Property
The Home Valuation Report is an in-depth analysis detailing your home's value as well as a comparison with similar homes in the area
Home Values in the Area
Average Home Value in this Area
Purchase History
| Date | Buyer | Sale Price | Title Company |
|---|---|---|---|
| Township Properties Llc | -- | Sterling Land Title Agcy Inc | |
| Li Elizabeth H | $248,000 | Landmark Ttl Agcy South Inc | |
| Meixner N Richard | -- | None Available | |
| Meixner Rose Marie | -- | -- |
Source: Public Records
Mortgage History
| Date | Status | Borrower | Loan Amount |
|---|---|---|---|
| Previous Owner | Li Elizabeth H | $184,000 | |
| Previous Owner | Meixner N Richard | $91,904 |
Source: Public Records
Tax History Compared to Growth
Tax History
| Year | Tax Paid | Tax Assessment Tax Assessment Total Assessment is a certain percentage of the fair market value that is determined by local assessors to be the total taxable value of land and additions on the property. | Land | Improvement |
|---|---|---|---|---|
| 2024 | $8,338 | $132,210 | $20,860 | $111,350 |
| 2023 | $8,338 | $132,210 | $20,860 | $111,350 |
| 2022 | $7,057 | $88,730 | $14,000 | $74,730 |
| 2021 | $7,076 | $88,730 | $14,000 | $74,730 |
| 2020 | $7,066 | $88,730 | $14,000 | $74,730 |
| 2019 | $5,594 | $72,870 | $14,000 | $58,870 |
| 2018 | $5,207 | $75,520 | $14,000 | $61,520 |
| 2017 | $5,151 | $75,520 | $14,000 | $61,520 |
| 2016 | $5,055 | $69,800 | $14,000 | $55,800 |
| 2015 | $4,917 | $69,800 | $14,000 | $55,800 |
| 2014 | $4,917 | $69,800 | $14,000 | $55,800 |
| 2012 | -- | $65,370 | $14,000 | $51,370 |
Source: Public Records
Map
Nearby Homes
- 7686 Brams Hill Dr
- 311 Windsor Park Dr
- 7758 Normandy Ln
- 7607 Paragon Commons Cir Unit 97607
- 8124 Julian Place
- 7789 Thomas Jefferson Ln Unit 1689
- 7710 John Hancock Ln Unit 637
- 982 Congress Park Dr Unit 21
- 7762 Mcewen Rd Unit 17
- 8286 Cornerstone Ct
- 240 Annette Dr
- 269 Annette Dr
- 6821 Paragon Rd
- 6917 Sycamore Creek Ct
- 1120 Beryl Trail
- 114 Forestview Dr
- 755 Hidden Cir Unit 623
- 8819 Washington Colony Dr Unit 15
- 1340 Penbrooke Trail
- 1187 Governors Square Dr