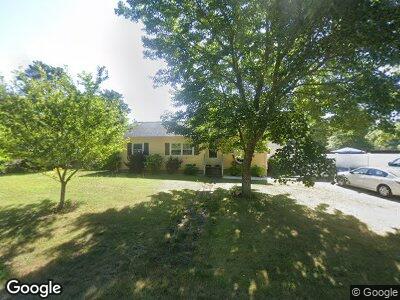
77 Birch St Plymouth, MA 02360
Estimated Value: $407,000 - $469,000
3
Beds
1
Bath
1,008
Sq Ft
$438/Sq Ft
Est. Value
About This Home
This home is located at 77 Birch St, Plymouth, MA 02360 and is currently estimated at $441,977, approximately $438 per square foot. 77 Birch St is a home located in Plymouth County with nearby schools including South Elementary School, Plymouth South Middle School, and Plymouth South High School.
Ownership History
Date
Name
Owned For
Owner Type
Purchase Details
Closed on
Oct 31, 2022
Sold by
Landry Jeffrey L
Bought by
Landry Jeffrey L and Mele Lisa
Current Estimated Value
Purchase Details
Closed on
Sep 30, 2008
Sold by
Frank Sherry L and Frank Joseph W
Bought by
Landry Jeffrey L
Home Financials for this Owner
Home Financials are based on the most recent Mortgage that was taken out on this home.
Original Mortgage
$115,000
Interest Rate
6.57%
Mortgage Type
Purchase Money Mortgage
Purchase Details
Closed on
Oct 14, 2003
Sold by
Lens Alexandra
Bought by
Frank Joseph W and Frank Sherry L
Purchase Details
Closed on
May 30, 2000
Sold by
Pagliuca Guy F and Pagliuca Jean M
Bought by
Lens Alexandra
Purchase Details
Closed on
Sep 24, 1998
Sold by
Chittenden Bernard R
Bought by
Olde Kings Llc
Purchase Details
Closed on
Feb 28, 1997
Sold by
Whitman Deborah A and Pagliuca Sarah E
Bought by
Pagliuca Guy F and Pagliuca Jean M
Create a Home Valuation Report for This Property
The Home Valuation Report is an in-depth analysis detailing your home's value as well as a comparison with similar homes in the area
Home Values in the Area
Average Home Value in this Area
Purchase History
| Date | Buyer | Sale Price | Title Company |
|---|---|---|---|
| Landry Jeffrey L | -- | None Available | |
| Landry Jeffrey L | $160,000 | -- | |
| Frank Joseph W | $226,000 | -- | |
| Lens Alexandra | $126,000 | -- | |
| Olde Kings Llc | $275,000 | -- | |
| Pagliuca Guy F | $90,000 | -- |
Source: Public Records
Mortgage History
| Date | Status | Borrower | Loan Amount |
|---|---|---|---|
| Previous Owner | Landry Jeffrey L | $169,000 | |
| Previous Owner | Pagliuca Guy F | $115,000 | |
| Previous Owner | Pagliuca Guy F | $274,500 |
Source: Public Records
Tax History Compared to Growth
Tax History
| Year | Tax Paid | Tax Assessment Tax Assessment Total Assessment is a certain percentage of the fair market value that is determined by local assessors to be the total taxable value of land and additions on the property. | Land | Improvement |
|---|---|---|---|---|
| 2025 | $4,971 | $391,700 | $186,300 | $205,400 |
| 2024 | $4,824 | $374,800 | $182,500 | $192,300 |
| 2023 | $4,630 | $337,700 | $159,300 | $178,400 |
| 2022 | $4,519 | $292,900 | $144,800 | $148,100 |
| 2021 | $4,206 | $260,300 | $144,800 | $115,500 |
| 2020 | $3,922 | $239,900 | $126,900 | $113,000 |
| 2019 | $3,659 | $221,200 | $113,000 | $108,200 |
| 2018 | $3,457 | $210,000 | $104,300 | $105,700 |
| 2017 | $3,321 | $200,300 | $104,300 | $96,000 |
| 2016 | $3,031 | $186,300 | $90,300 | $96,000 |
| 2015 | $2,977 | $191,600 | $95,600 | $96,000 |
| 2014 | $2,920 | $193,000 | $100,900 | $92,100 |
Source: Public Records
Map
Nearby Homes
- 33 Nickerson St
- 45 Walnut St
- 15 Downey St
- 20 D Knollview Rd Unit 20D
- 66 Barker Rd
- 3 Nokomis Rd
- 51 Nye Ln
- 4 Sonny's Dr
- 49 Martin St
- 5 Williamsburg Ln
- 115 Lake Ave
- 42 Wareham Lake Shore Dr
- 70 Fearing St
- 22 Morrison St
- 151 Lake Ave
- 167 Park Ave
- 36 Restful Ln
- 37 Mayflower Way
- 63 Mayflower Ln
- 222 Lake Ave