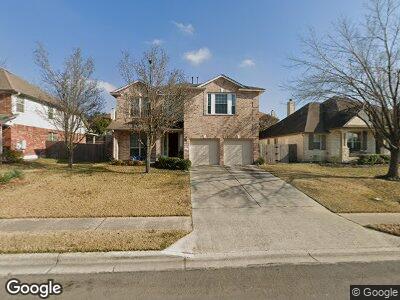
7711 Covered Bridge Dr Austin, TX 78736
West Oak Hill NeighborhoodEstimated Value: $691,046 - $703,000
5
Beds
3
Baths
3,105
Sq Ft
$224/Sq Ft
Est. Value
About This Home
This home is located at 7711 Covered Bridge Dr, Austin, TX 78736 and is currently estimated at $697,023, approximately $224 per square foot. 7711 Covered Bridge Dr is a home located in Travis County with nearby schools including Oak Hill Elementary School, Small Middle School, and James Bowie High School.
Ownership History
Date
Name
Owned For
Owner Type
Purchase Details
Closed on
Sep 21, 2006
Sold by
Gonzales Edward and Gonzales Patricia
Bought by
Mohammad Nur and Baksh Nahid Farzana
Current Estimated Value
Home Financials for this Owner
Home Financials are based on the most recent Mortgage that was taken out on this home.
Original Mortgage
$195,000
Outstanding Balance
$119,381
Interest Rate
6.47%
Mortgage Type
Purchase Money Mortgage
Estimated Equity
$577,642
Purchase Details
Closed on
Mar 29, 2005
Sold by
Wilshire Hearthstone Venture I Lp
Bought by
Gonzales Edward and Gonzales Patricia
Home Financials for this Owner
Home Financials are based on the most recent Mortgage that was taken out on this home.
Original Mortgage
$214,400
Interest Rate
5.71%
Mortgage Type
Fannie Mae Freddie Mac
Create a Home Valuation Report for This Property
The Home Valuation Report is an in-depth analysis detailing your home's value as well as a comparison with similar homes in the area
Home Values in the Area
Average Home Value in this Area
Purchase History
| Date | Buyer | Sale Price | Title Company |
|---|---|---|---|
| Mohammad Nur | -- | Opr Title Agency Llc | |
| Gonzales Edward | -- | Towne & Country Title Inc |
Source: Public Records
Mortgage History
| Date | Status | Borrower | Loan Amount |
|---|---|---|---|
| Open | Mohammad Nur | $83,080 | |
| Open | Mohammad Nur | $195,000 | |
| Previous Owner | Gonzales Edward | $214,400 |
Source: Public Records
Tax History Compared to Growth
Tax History
| Year | Tax Paid | Tax Assessment Tax Assessment Total Assessment is a certain percentage of the fair market value that is determined by local assessors to be the total taxable value of land and additions on the property. | Land | Improvement |
|---|---|---|---|---|
| 2023 | $9,137 | $610,253 | $0 | $0 |
| 2022 | $10,956 | $554,775 | $0 | $0 |
| 2021 | $10,978 | $504,341 | $100,000 | $404,341 |
| 2020 | $10,383 | $484,092 | $100,000 | $384,092 |
| 2018 | $9,685 | $437,435 | $100,000 | $337,435 |
| 2017 | $9,431 | $422,880 | $60,000 | $362,880 |
| 2016 | $9,120 | $408,956 | $60,000 | $348,956 |
| 2015 | $7,853 | $388,539 | $60,000 | $328,539 |
| 2014 | $7,853 | $355,280 | $60,000 | $295,280 |
Source: Public Records
Map
Nearby Homes
- 7519 Black Mountain Dr
- 7604 Chelmsford Dr
- 8623 Foggy Mountain Dr
- 7220 Roaring Springs Dr
- 8504 Highway 290 W
- 8412 Lookout Cliff Pass
- 8202 Burnt Cir
- 7105 Windthorst Cove
- 8409 Lookout Cliff Pass
- 8737 W Highway 71
- 7004 Covered Bridge Dr
- 8804 Vantage Point Dr
- 7905 Flintstone Cove
- 8904 Sam Carter Dr
- 8516 Whispering Trail
- 6818 Halesboro Dr
- 7221 S Brook Dr
- 9011 Dorella Ln
- 6914 Rifle Bend
- 6705 Covered Bridge Dr Unit 36