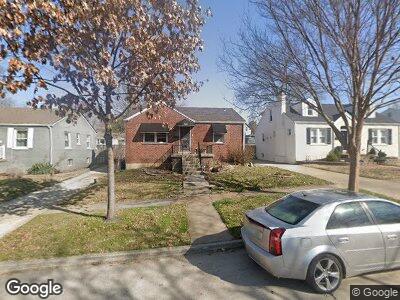
7727 Saint Albans Ave Saint Louis, MO 63117
Estimated Value: $224,000 - $308,684
2
Beds
1
Bath
1,440
Sq Ft
$195/Sq Ft
Est. Value
About This Home
This home is located at 7727 Saint Albans Ave, Saint Louis, MO 63117 and is currently estimated at $281,171, approximately $195 per square foot. 7727 Saint Albans Ave is a home located in St. Louis County with nearby schools including Maplewood Richmond Heights Elementary School, Maplewood Richmond Heights Middle School, and Maplewood-Richmond Heights High School.
Create a Home Valuation Report for This Property
The Home Valuation Report is an in-depth analysis detailing your home's value as well as a comparison with similar homes in the area
Home Values in the Area
Average Home Value in this Area
Mortgage History
| Date | Status | Borrower | Loan Amount |
|---|---|---|---|
| Closed | Smith | $35,000 |
Source: Public Records
Tax History Compared to Growth
Tax History
| Year | Tax Paid | Tax Assessment Tax Assessment Total Assessment is a certain percentage of the fair market value that is determined by local assessors to be the total taxable value of land and additions on the property. | Land | Improvement |
|---|---|---|---|---|
| 2023 | $3,848 | $50,600 | $20,520 | $30,080 |
| 2022 | $3,836 | $46,660 | $20,520 | $26,140 |
| 2021 | $3,770 | $46,660 | $20,520 | $26,140 |
| 2020 | $3,529 | $41,390 | $17,580 | $23,810 |
| 2019 | $3,501 | $41,390 | $17,580 | $23,810 |
| 2018 | $3,281 | $35,170 | $11,550 | $23,620 |
| 2017 | $3,258 | $35,170 | $11,550 | $23,620 |
| 2016 | $2,837 | $29,490 | $10,600 | $18,890 |
| 2015 | $2,667 | $29,490 | $10,600 | $18,890 |
| 2014 | $2,690 | $29,820 | $7,700 | $22,120 |
Source: Public Records
Map
Nearby Homes
- 7710 Saint Albans Ave
- 7740 Dale Ave
- 1502 Bredell Ave
- 8015 Hicks Ave
- 7705 W Bruno Ave
- 7633 Lindbergh Dr
- 7921 W Bruno Ave
- 7923 W Bruno Ave
- 1260 Moorlands Dr
- 7780 Williams Ct
- 7720 Lile Ave
- 1323 Woodland Dr
- 7581 Warner Ave
- 1211 Boland Place
- 7483 Hiawatha Ave
- 7734 Wise Ave
- 49 Hanley Downs
- 7552 Weaver Ave
- 1129 Moorlands Dr
- 7716 Jerome Ave