7803 Foxhound Rd McLean, VA 22102
Estimated Value: $1,507,000 - $1,884,000
4
Beds
5
Baths
4,236
Sq Ft
$392/Sq Ft
Est. Value
About This Home
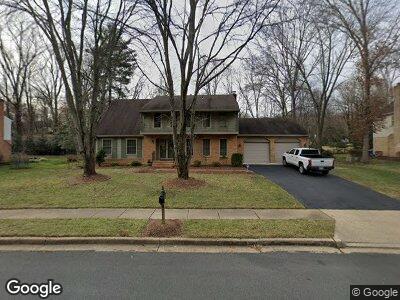
This home is located at 7803 Foxhound Rd, McLean, VA 22102 and is currently estimated at $1,662,509, approximately $392 per square foot. 7803 Foxhound Rd is a home located in Fairfax County with nearby schools including Spring Hill Elementary School, Cooper Middle School, and Langley High School.
Ownership History
Date
Name
Owned For
Owner Type
Purchase Details
Closed on
Mar 3, 2004
Sold by
Nance Mary L
Bought by
Evans Stephen D
Current Estimated Value
Home Financials for this Owner
Home Financials are based on the most recent Mortgage that was taken out on this home.
Original Mortgage
$550,000
Interest Rate
5.67%
Mortgage Type
New Conventional
Create a Home Valuation Report for This Property
The Home Valuation Report is an in-depth analysis detailing your home's value as well as a comparison with similar homes in the area
Home Values in the Area
Average Home Value in this Area
Purchase History
| Date | Buyer | Sale Price | Title Company |
|---|---|---|---|
| Evans Stephen D | $800,000 | -- |
Source: Public Records
Mortgage History
| Date | Status | Borrower | Loan Amount |
|---|---|---|---|
| Open | Evans Stephen D | $490,100 | |
| Closed | Evans Stephen D | $488,500 | |
| Closed | Evans Stephen D | $550,000 |
Source: Public Records
Tax History Compared to Growth
Tax History
| Year | Tax Paid | Tax Assessment Tax Assessment Total Assessment is a certain percentage of the fair market value that is determined by local assessors to be the total taxable value of land and additions on the property. | Land | Improvement |
|---|---|---|---|---|
| 2024 | $16,349 | $1,383,750 | $563,000 | $820,750 |
| 2023 | $15,494 | $1,345,510 | $556,000 | $789,510 |
| 2022 | $13,782 | $1,181,470 | $556,000 | $625,470 |
| 2021 | $12,642 | $1,056,610 | $488,000 | $568,610 |
| 2020 | $12,888 | $1,068,210 | $488,000 | $580,210 |
| 2019 | $12,751 | $1,056,830 | $488,000 | $568,830 |
| 2018 | $12,154 | $1,056,830 | $488,000 | $568,830 |
| 2017 | $11,438 | $966,010 | $488,000 | $478,010 |
| 2016 | $11,413 | $966,010 | $488,000 | $478,010 |
| 2015 | $11,439 | $1,004,260 | $488,000 | $516,260 |
| 2014 | $10,436 | $918,220 | $488,000 | $430,220 |
Source: Public Records
Map
Nearby Homes
- 7903 Old Falls Rd
- 7916 Lewinsville Rd
- 1106 Mill Ridge
- 7900 Old Cedar Ct
- 8007 Lewinsville Rd
- 7605 Timberly Ct
- 7707 Carlton Place
- 8021 Agin Ct
- 1029 Founders Ridge Ln
- 8023 Lewinsville Rd
- 1035 Gelston Cir
- 1034 Founders Ridge Ln
- 8115 Spring Hill Farm Dr
- 8023 Old Dominion Dr
- 7805 Grovemont Dr
- 8104 Cawdor Ct
- 932 Woburn Ct
- 1071 Spring Hill Rd
- 919 Dominion Reserve Dr
- 7507 Box Elder Ct