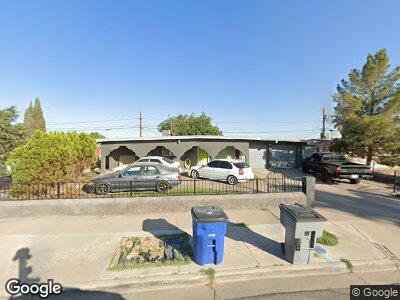
7870 Broadway Dr El Paso, TX 79915
Thomas Manor NeighborhoodEstimated Value: $185,000 - $201,422
3
Beds
2
Baths
1,723
Sq Ft
$111/Sq Ft
Est. Value
About This Home
This home is located at 7870 Broadway Dr, El Paso, TX 79915 and is currently estimated at $192,106, approximately $111 per square foot. 7870 Broadway Dr is a home located in El Paso County with nearby schools including Thomas Manor, Riverside Middle School, and Riverside High School.
Ownership History
Date
Name
Owned For
Owner Type
Purchase Details
Closed on
May 19, 2021
Sold by
Nunez Jose L and Nunez Martha O
Bought by
Campos Yesenia and Nunez Alexis
Current Estimated Value
Home Financials for this Owner
Home Financials are based on the most recent Mortgage that was taken out on this home.
Original Mortgage
$88,000
Outstanding Balance
$80,986
Interest Rate
3%
Mortgage Type
New Conventional
Estimated Equity
$111,120
Purchase Details
Closed on
Apr 17, 1999
Sold by
Martinez Virginia
Bought by
Nunez Jose L and Nunez Martha O
Home Financials for this Owner
Home Financials are based on the most recent Mortgage that was taken out on this home.
Original Mortgage
$51,943
Interest Rate
7.16%
Mortgage Type
FHA
Purchase Details
Closed on
Jan 26, 1995
Sold by
Godina Maria Luisa
Bought by
Martinez Virginia
Create a Home Valuation Report for This Property
The Home Valuation Report is an in-depth analysis detailing your home's value as well as a comparison with similar homes in the area
Home Values in the Area
Average Home Value in this Area
Purchase History
| Date | Buyer | Sale Price | Title Company |
|---|---|---|---|
| Campos Yesenia | -- | None Available | |
| Nunez Jose L | -- | -- | |
| Martinez Virginia | -- | -- |
Source: Public Records
Mortgage History
| Date | Status | Borrower | Loan Amount |
|---|---|---|---|
| Open | Campos Yesenia | $88,000 | |
| Closed | Nunez Jose L | $51,000 | |
| Closed | Nunez Jose L | $51,943 |
Source: Public Records
Tax History Compared to Growth
Tax History
| Year | Tax Paid | Tax Assessment Tax Assessment Total Assessment is a certain percentage of the fair market value that is determined by local assessors to be the total taxable value of land and additions on the property. | Land | Improvement |
|---|---|---|---|---|
| 2023 | $2,557 | $147,007 | $12,953 | $134,054 |
| 2022 | $4,565 | $147,007 | $12,953 | $134,054 |
| 2021 | $3,175 | $118,394 | $12,953 | $105,441 |
| 2020 | $2,805 | $88,801 | $12,953 | $75,848 |
| 2018 | $2,756 | $88,620 | $12,953 | $75,667 |
| 2017 | $2,693 | $88,099 | $12,953 | $75,146 |
| 2016 | $2,693 | $88,099 | $12,953 | $75,146 |
| 2015 | $2,069 | $88,099 | $12,953 | $75,146 |
| 2014 | $2,069 | $90,026 | $12,953 | $77,073 |
Source: Public Records
Map
Nearby Homes