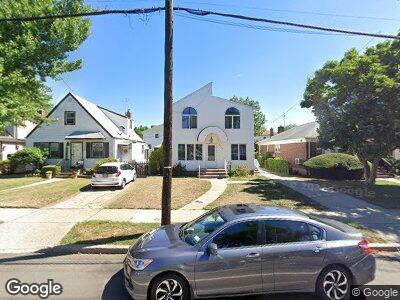
7943 263rd St Glen Oaks, NY 11004
Estimated Value: $884,000 - $984,000
5
Beds
2
Baths
1,700
Sq Ft
$550/Sq Ft
Est. Value
About This Home
This home is located at 7943 263rd St, Glen Oaks, NY 11004 and is currently estimated at $935,009, approximately $550 per square foot. 7943 263rd St is a home located in Queens County with nearby schools including P.S.115Q James J Ambrose School, Irwin Altman Middle School 172, and Martin Van Buren High School.
Ownership History
Date
Name
Owned For
Owner Type
Purchase Details
Closed on
May 22, 2014
Sold by
Ibrahim Almas and Mitha Almas
Bought by
7943 Realty Llc
Current Estimated Value
Purchase Details
Closed on
Feb 26, 2002
Sold by
Ibrahim Almas and Ali Durreshawar
Bought by
Ibrahim Almas
Purchase Details
Closed on
May 22, 1996
Sold by
Langner Howard
Bought by
Ibrahim Almas and Ali Dureeshwar
Home Financials for this Owner
Home Financials are based on the most recent Mortgage that was taken out on this home.
Original Mortgage
$150,000
Interest Rate
8.05%
Purchase Details
Closed on
Apr 29, 1994
Sold by
Redd Bonnie Lynn and Feder Pamela Francine
Bought by
Langner Howard
Home Financials for this Owner
Home Financials are based on the most recent Mortgage that was taken out on this home.
Original Mortgage
$105,000
Interest Rate
4.1%
Purchase Details
Closed on
Jul 6, 1993
Sold by
Toscher Harvey
Bought by
Redd Bonnie Lynn and Feder Pamela Francine
Create a Home Valuation Report for This Property
The Home Valuation Report is an in-depth analysis detailing your home's value as well as a comparison with similar homes in the area
Home Values in the Area
Average Home Value in this Area
Purchase History
| Date | Buyer | Sale Price | Title Company |
|---|---|---|---|
| 7943 Realty Llc | -- | -- | |
| Ibrahim Almas | -- | -- | |
| Ibrahim Almas | $290,000 | Commonwealth Land Title Ins | |
| Redd Bonnie Lynn | -- | American Title Insurance Com |
Source: Public Records
Mortgage History
| Date | Status | Borrower | Loan Amount |
|---|---|---|---|
| Previous Owner | Ibrahim Almas | $150,000 | |
| Previous Owner | Langner Howard | $105,000 |
Source: Public Records
Tax History Compared to Growth
Tax History
| Year | Tax Paid | Tax Assessment Tax Assessment Total Assessment is a certain percentage of the fair market value that is determined by local assessors to be the total taxable value of land and additions on the property. | Land | Improvement |
|---|---|---|---|---|
| 2024 | $9,319 | $46,397 | $14,833 | $31,564 |
| 2023 | $8,990 | $44,267 | $13,421 | $30,846 |
| 2022 | $6,253 | $51,300 | $18,300 | $33,000 |
| 2021 | $8,291 | $48,300 | $18,300 | $30,000 |
| 2020 | $8,184 | $46,140 | $18,300 | $27,840 |
| 2019 | $8,088 | $43,620 | $18,300 | $25,320 |
| 2018 | $7,520 | $36,889 | $14,727 | $22,162 |
| 2017 | $7,094 | $34,801 | $16,742 | $18,059 |
| 2016 | $6,563 | $34,801 | $16,742 | $18,059 |
| 2015 | $3,740 | $32,220 | $20,340 | $11,880 |
| 2014 | $3,740 | $32,220 | $20,340 | $11,880 |
Source: Public Records
Map
Nearby Homes
- 80-32 264th St
- 265-06 80th Ave
- 80-18 261st St
- 263-05 81st Ave
- 260-37 Union Turnpike Unit 2nd fl
- 259-20 80th Ave
- 8045 259th St
- 259-09 81st Ave
- 259-03 81st Ave
- 80-60 268th St
- 80-59 268th St
- 26415 82nd Ave
- 7637 266th St
- 80-07 257th St
- 81-31 259th St
- 81-23 268th St
- 81- 56 Langdale St Unit 81-56
- 79-31 Langdale St
- 82-30 266th St
- 270-04 81st Ave Unit 219B