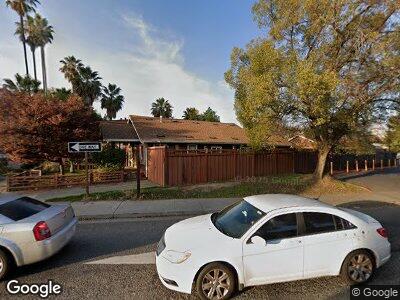
790 S 10th St San Jose, CA 95112
Naglee Park NeighborhoodEstimated Value: $894,000 - $1,059,000
3
Beds
2
Baths
1,248
Sq Ft
$796/Sq Ft
Est. Value
About This Home
This home is located at 790 S 10th St, San Jose, CA 95112 and is currently estimated at $993,904, approximately $796 per square foot. 790 S 10th St is a home located in Santa Clara County with nearby schools including Lowell Elementary School, Herbert Hoover Middle School, and Abraham Lincoln High.
Ownership History
Date
Name
Owned For
Owner Type
Purchase Details
Closed on
Oct 25, 2010
Sold by
Benavidez Medardo and Benavidez Alicia C
Bought by
Kerrigan Daniel Robert
Current Estimated Value
Home Financials for this Owner
Home Financials are based on the most recent Mortgage that was taken out on this home.
Original Mortgage
$260,000
Interest Rate
4.33%
Mortgage Type
New Conventional
Purchase Details
Closed on
Jul 24, 1998
Sold by
Sadeghirad Hossein A and Sadeghirad Karen A
Bought by
Benavidez Medardo and Benavidez Alicia C
Home Financials for this Owner
Home Financials are based on the most recent Mortgage that was taken out on this home.
Original Mortgage
$142,200
Interest Rate
9.25%
Create a Home Valuation Report for This Property
The Home Valuation Report is an in-depth analysis detailing your home's value as well as a comparison with similar homes in the area
Home Values in the Area
Average Home Value in this Area
Purchase History
| Date | Buyer | Sale Price | Title Company |
|---|---|---|---|
| Kerrigan Daniel Robert | $325,000 | Old Republic Title Company | |
| Benavidez Medardo | $158,000 | Fidelity National Title Co |
Source: Public Records
Mortgage History
| Date | Status | Borrower | Loan Amount |
|---|---|---|---|
| Open | Kerrigan Daniel Robert | $285,000 | |
| Closed | Kerrigan Daniel Robert | $260,000 | |
| Previous Owner | Benavidez Medardo | $508,000 | |
| Previous Owner | Benavidez Medardo | $472,000 | |
| Previous Owner | Benavidez Medardo | $336,000 | |
| Previous Owner | Benavidez Medardo | $59,354 | |
| Previous Owner | Benavidez Medardo | $13,442 | |
| Previous Owner | Benavidez Medardo | $230,000 | |
| Previous Owner | Benavidez Medardo | $45,000 | |
| Previous Owner | Benavidez Medardo | $142,200 |
Source: Public Records
Tax History Compared to Growth
Tax History
| Year | Tax Paid | Tax Assessment Tax Assessment Total Assessment is a certain percentage of the fair market value that is determined by local assessors to be the total taxable value of land and additions on the property. | Land | Improvement |
|---|---|---|---|---|
| 2023 | $6,753 | $400,204 | $280,146 | $120,058 |
| 2022 | $6,586 | $392,357 | $274,653 | $117,704 |
| 2021 | $6,381 | $384,665 | $269,268 | $115,397 |
| 2020 | $6,139 | $380,721 | $266,507 | $114,214 |
| 2019 | $5,961 | $373,257 | $261,282 | $111,975 |
| 2018 | $5,870 | $365,939 | $256,159 | $109,780 |
| 2017 | $5,803 | $358,765 | $251,137 | $107,628 |
| 2016 | $5,634 | $351,731 | $246,213 | $105,518 |
| 2015 | $5,204 | $346,449 | $242,515 | $103,934 |
| 2014 | $4,770 | $339,664 | $237,765 | $101,899 |
Source: Public Records
Map
Nearby Homes
- 774 S 12th St
- 680 S 12th St
- 952 S 11th St Unit 334
- 952 S 11th St Unit 134
- 956 S 9th St
- 951 S 12th St Unit 110
- 585 S 10th St
- 1012 S 11th St
- 575 S 14th St
- 360 E William St
- 371 E William St
- 455 S 12th St
- 1131 S 10th St
- 456 E San Salvador St
- 125 Patterson St Unit 136
- 125 Patterson St Unit 121
- 125 Patterson St Unit 239
- 737 Forestdale Ave
- 499 S 5th St
- 627 S 3rd St